The developer console allows our tech team (and you) to see exactly what’s happening behind the scenes on a webpage.
It’s a really useful tool for troubleshooting, as it flags any errors that occur while you’re performing a task on a website and provides information about scripts.
If something’s going wrong when you’re trying to edit your webpage (like uploading a video or adding a widget) but you just can’t figure out what, taking a look at the developer console can help to solve the issue.
Jump to:
You can view the developer console in every browser, but the steps to access it is slightly different for each one. To find the console follow these simple steps for whichever browser you are using.
In Google Chrome
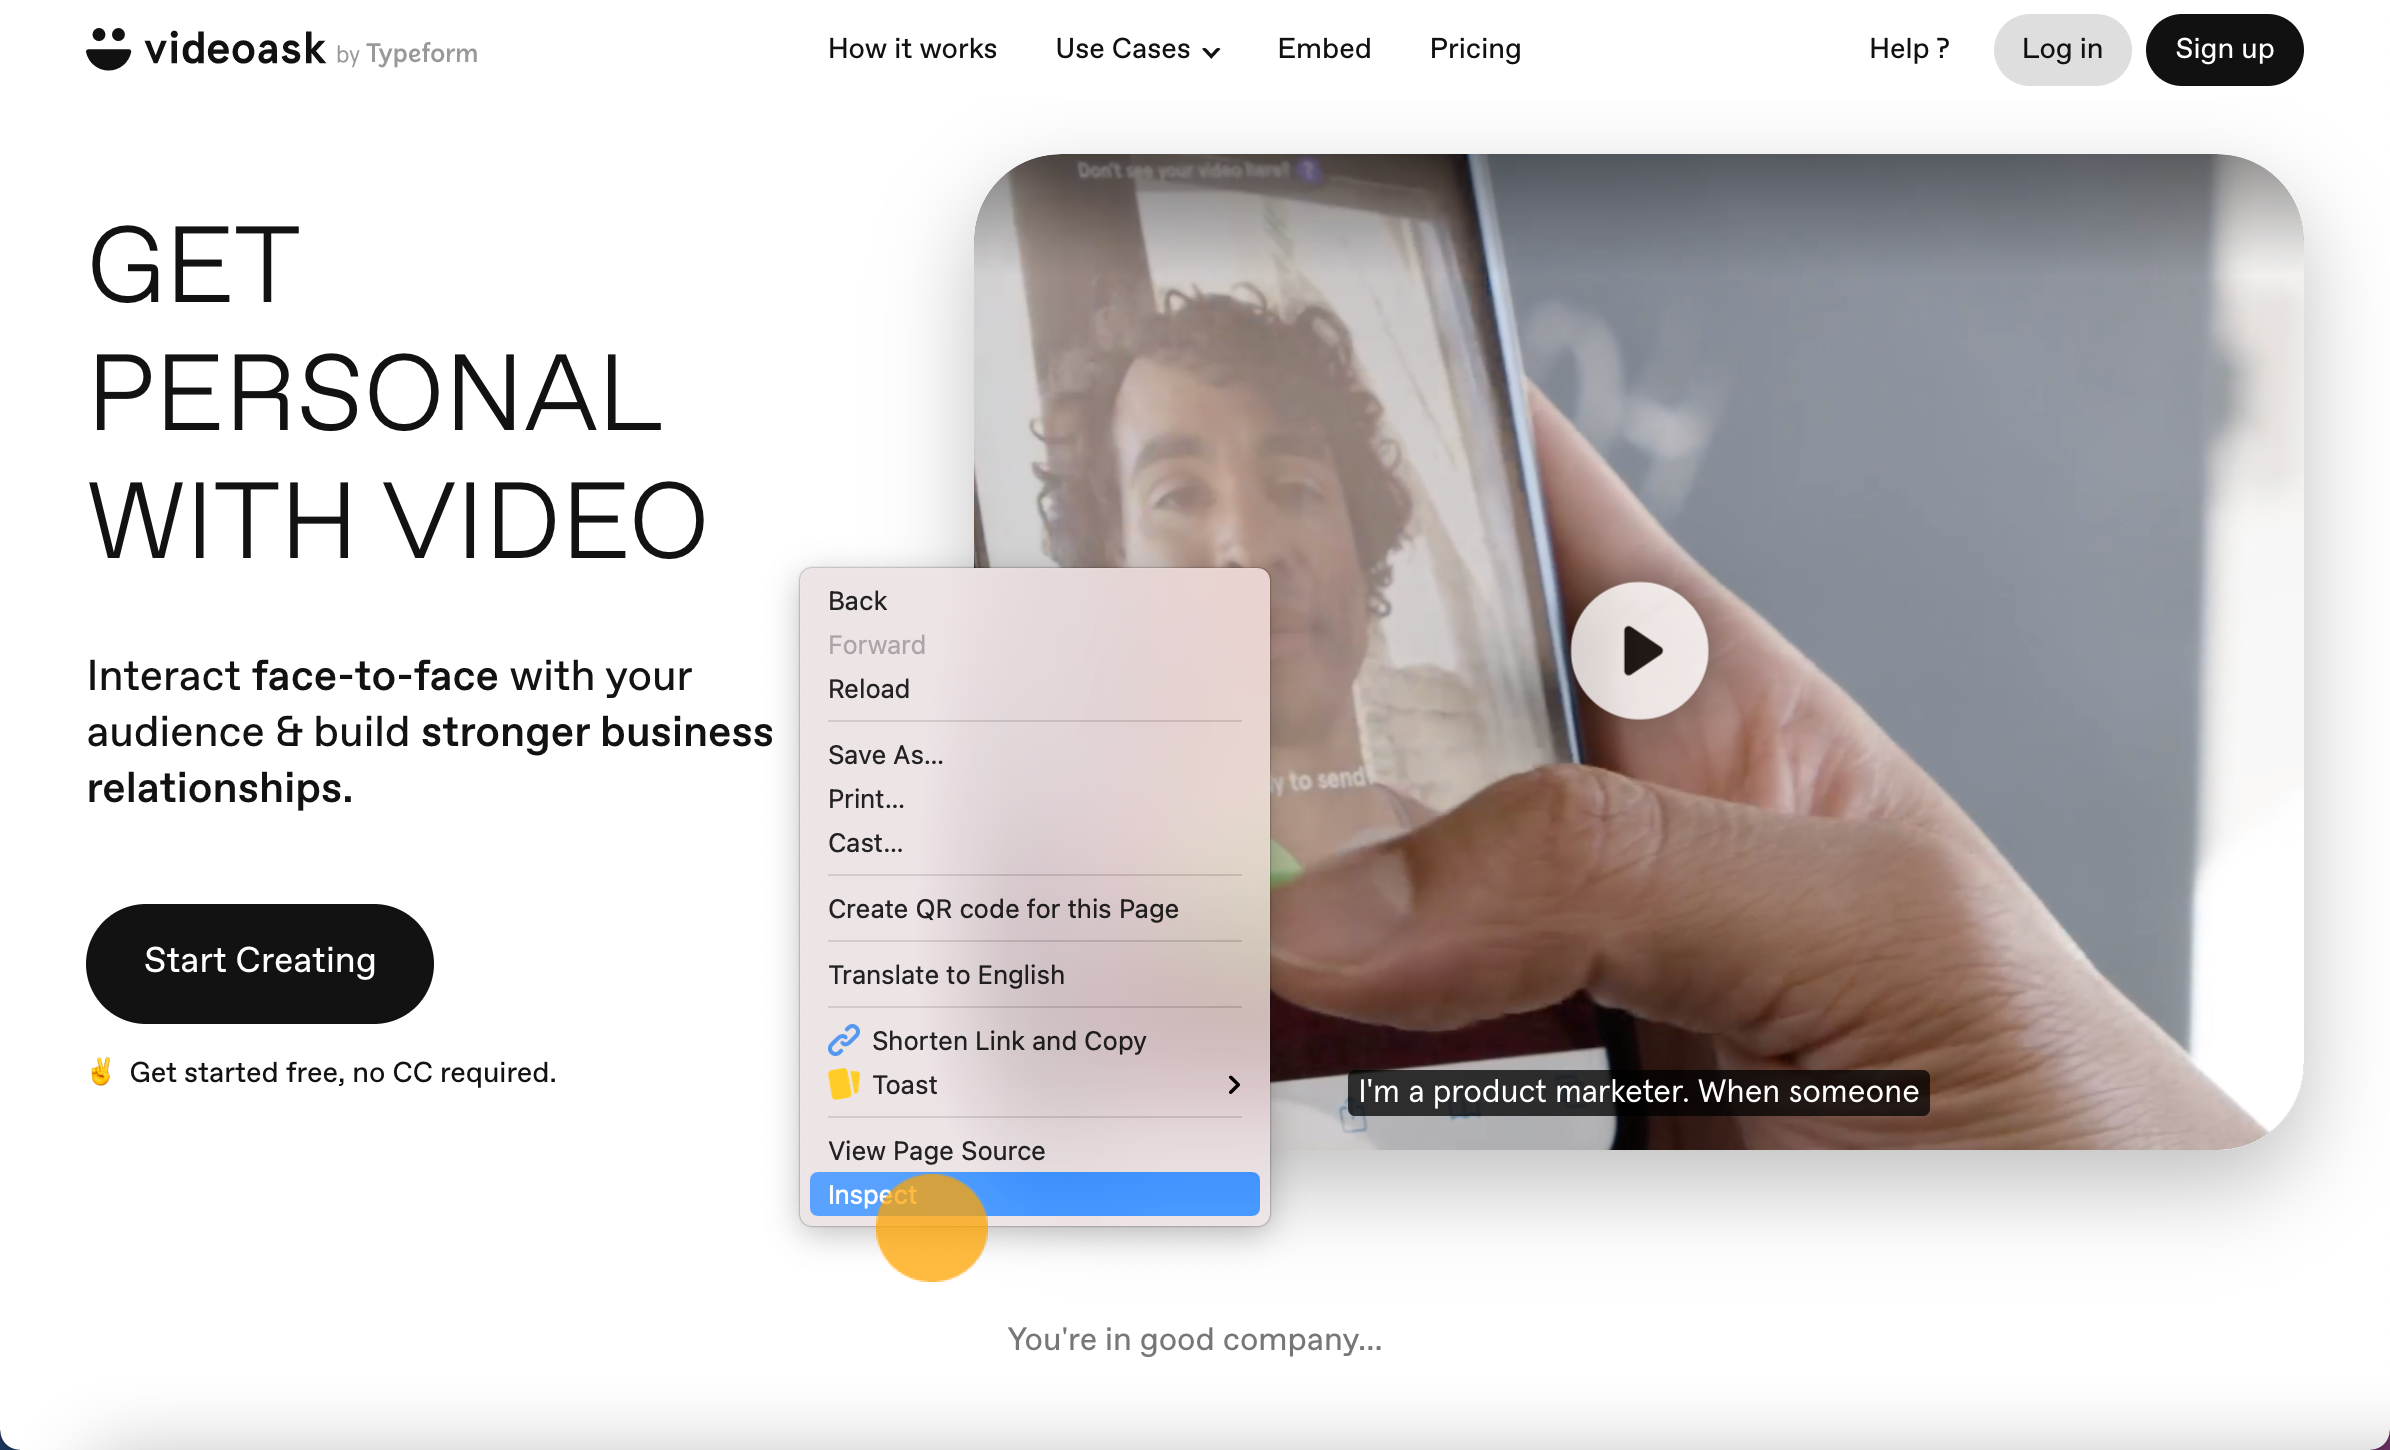
Right-click anywhere on the webpage that you're experiencing problems and select Inspect.
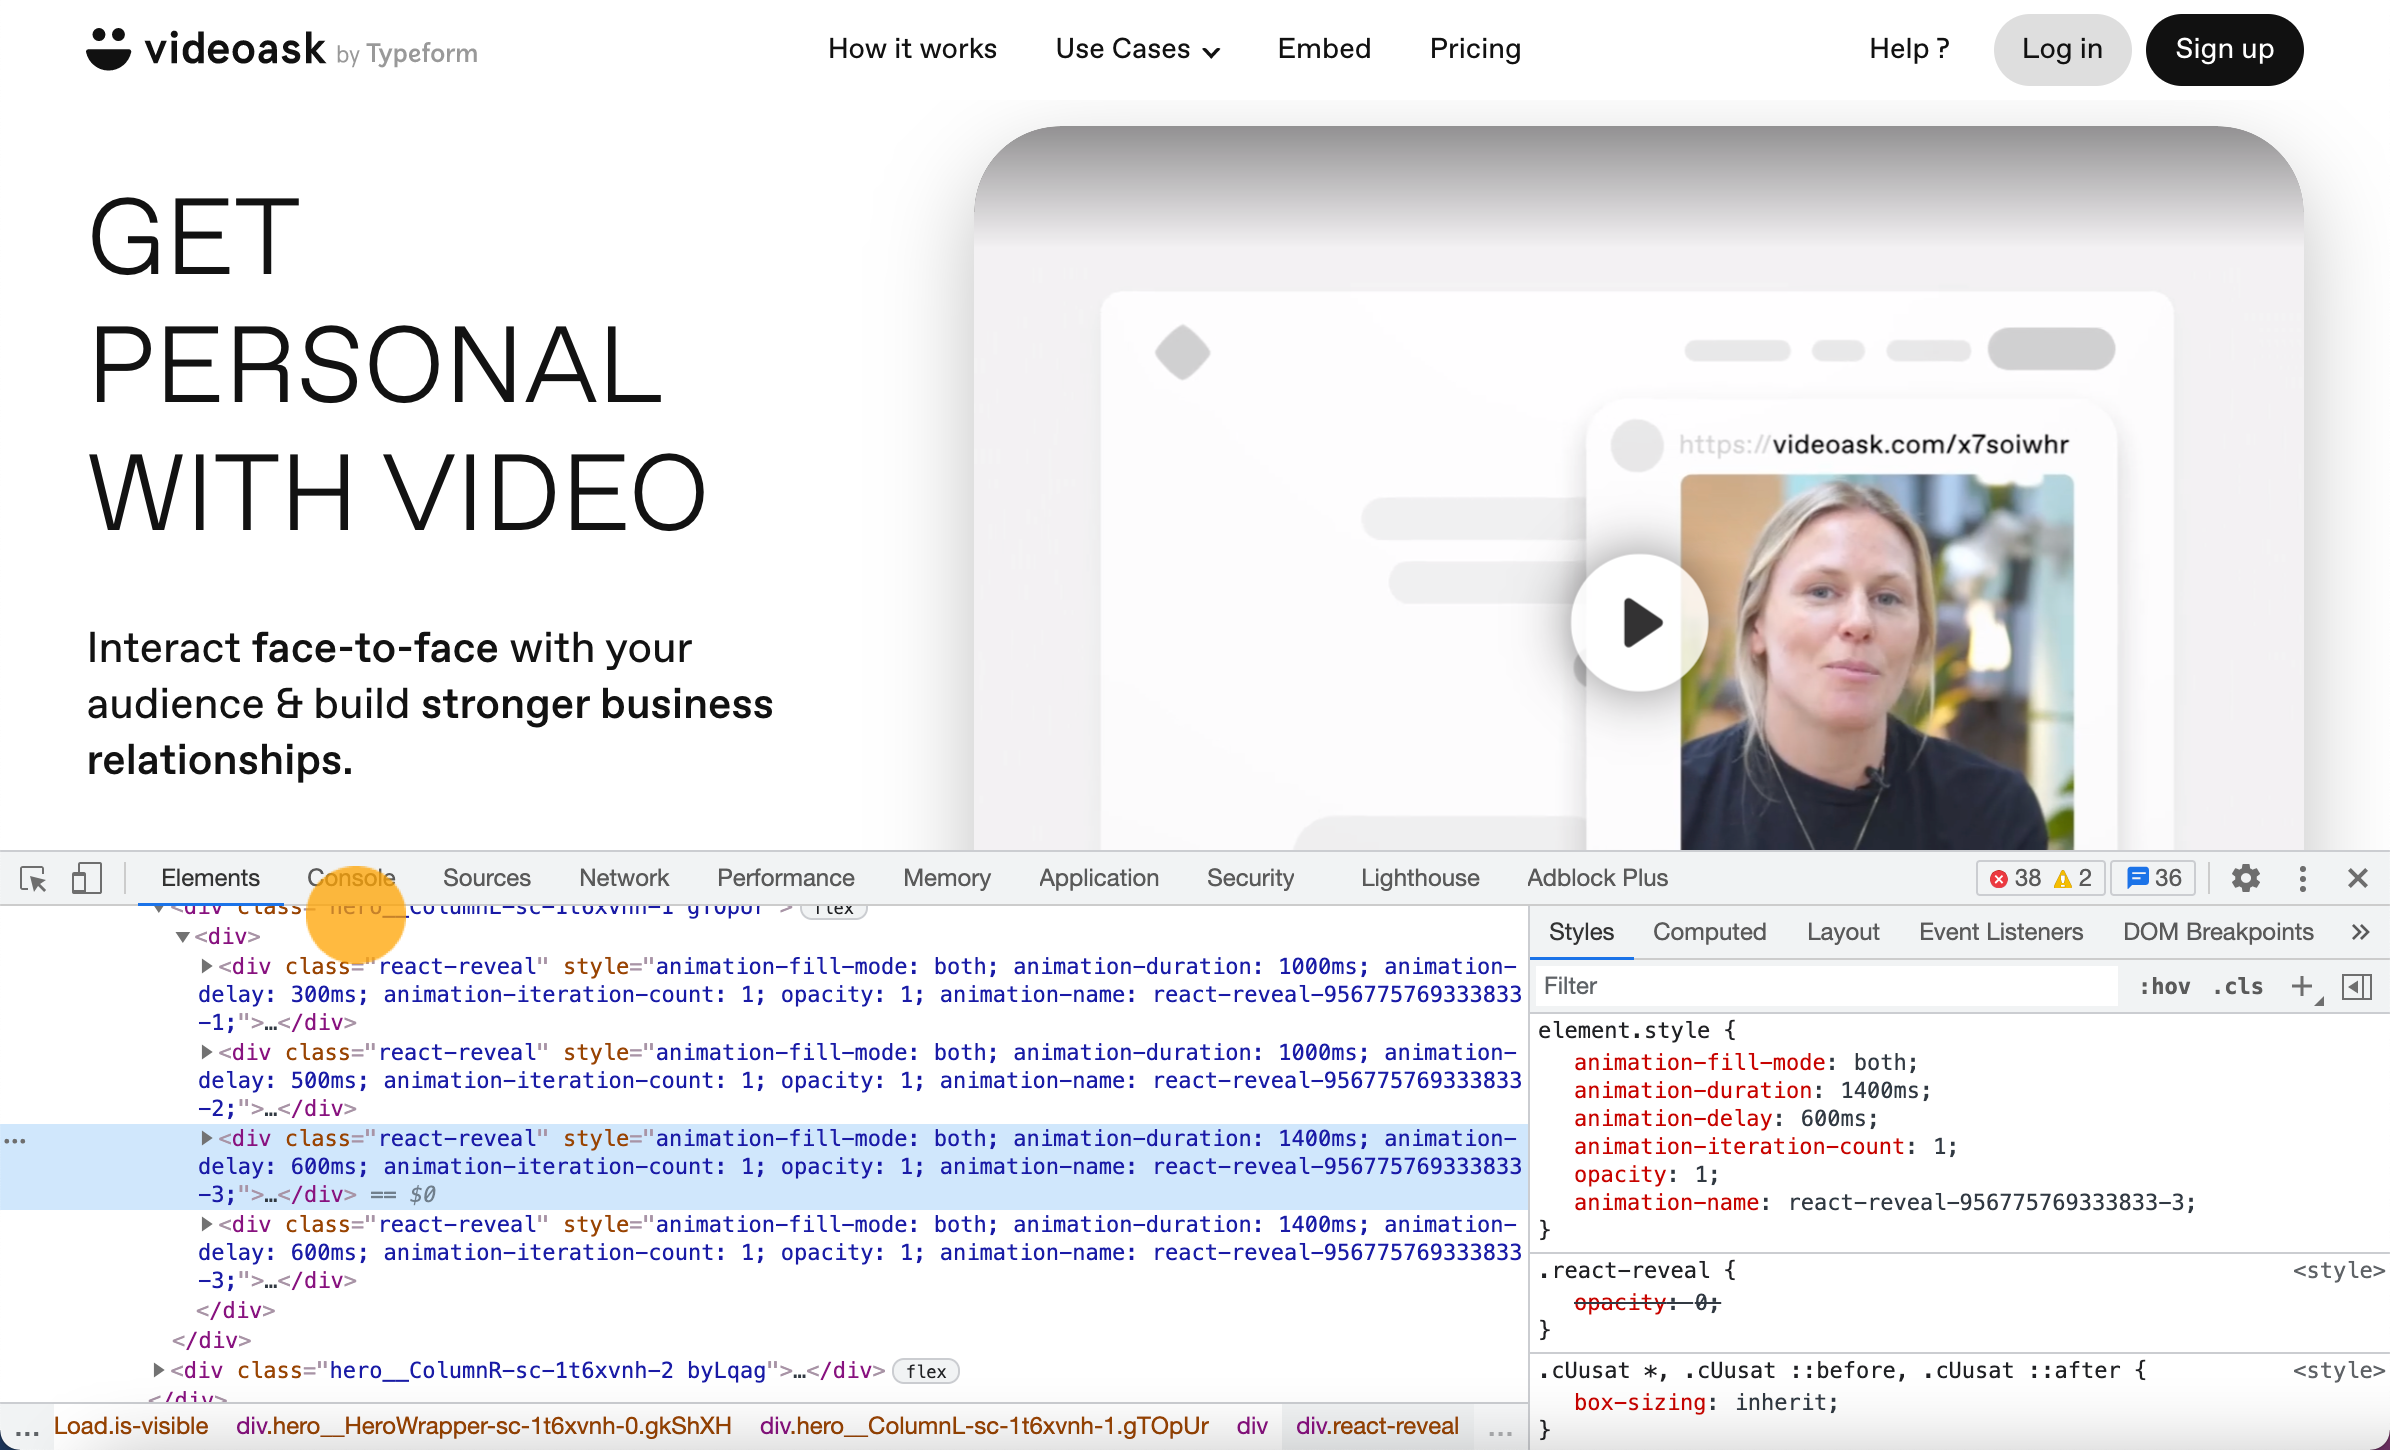
A window will appear on the right-hand side or bottom of your screen. Select the Console tab at the top of this window.
Note: For a handy shortcut in Google Chrome press F12 or ⌘ + Opt + J (Mac) or Shift + CTRL + J (Windows) to take you directly to the developer console.
Have another go at completing the action that hasn’t been working for you, this time with the developer console open. You should see an error message appear in red.
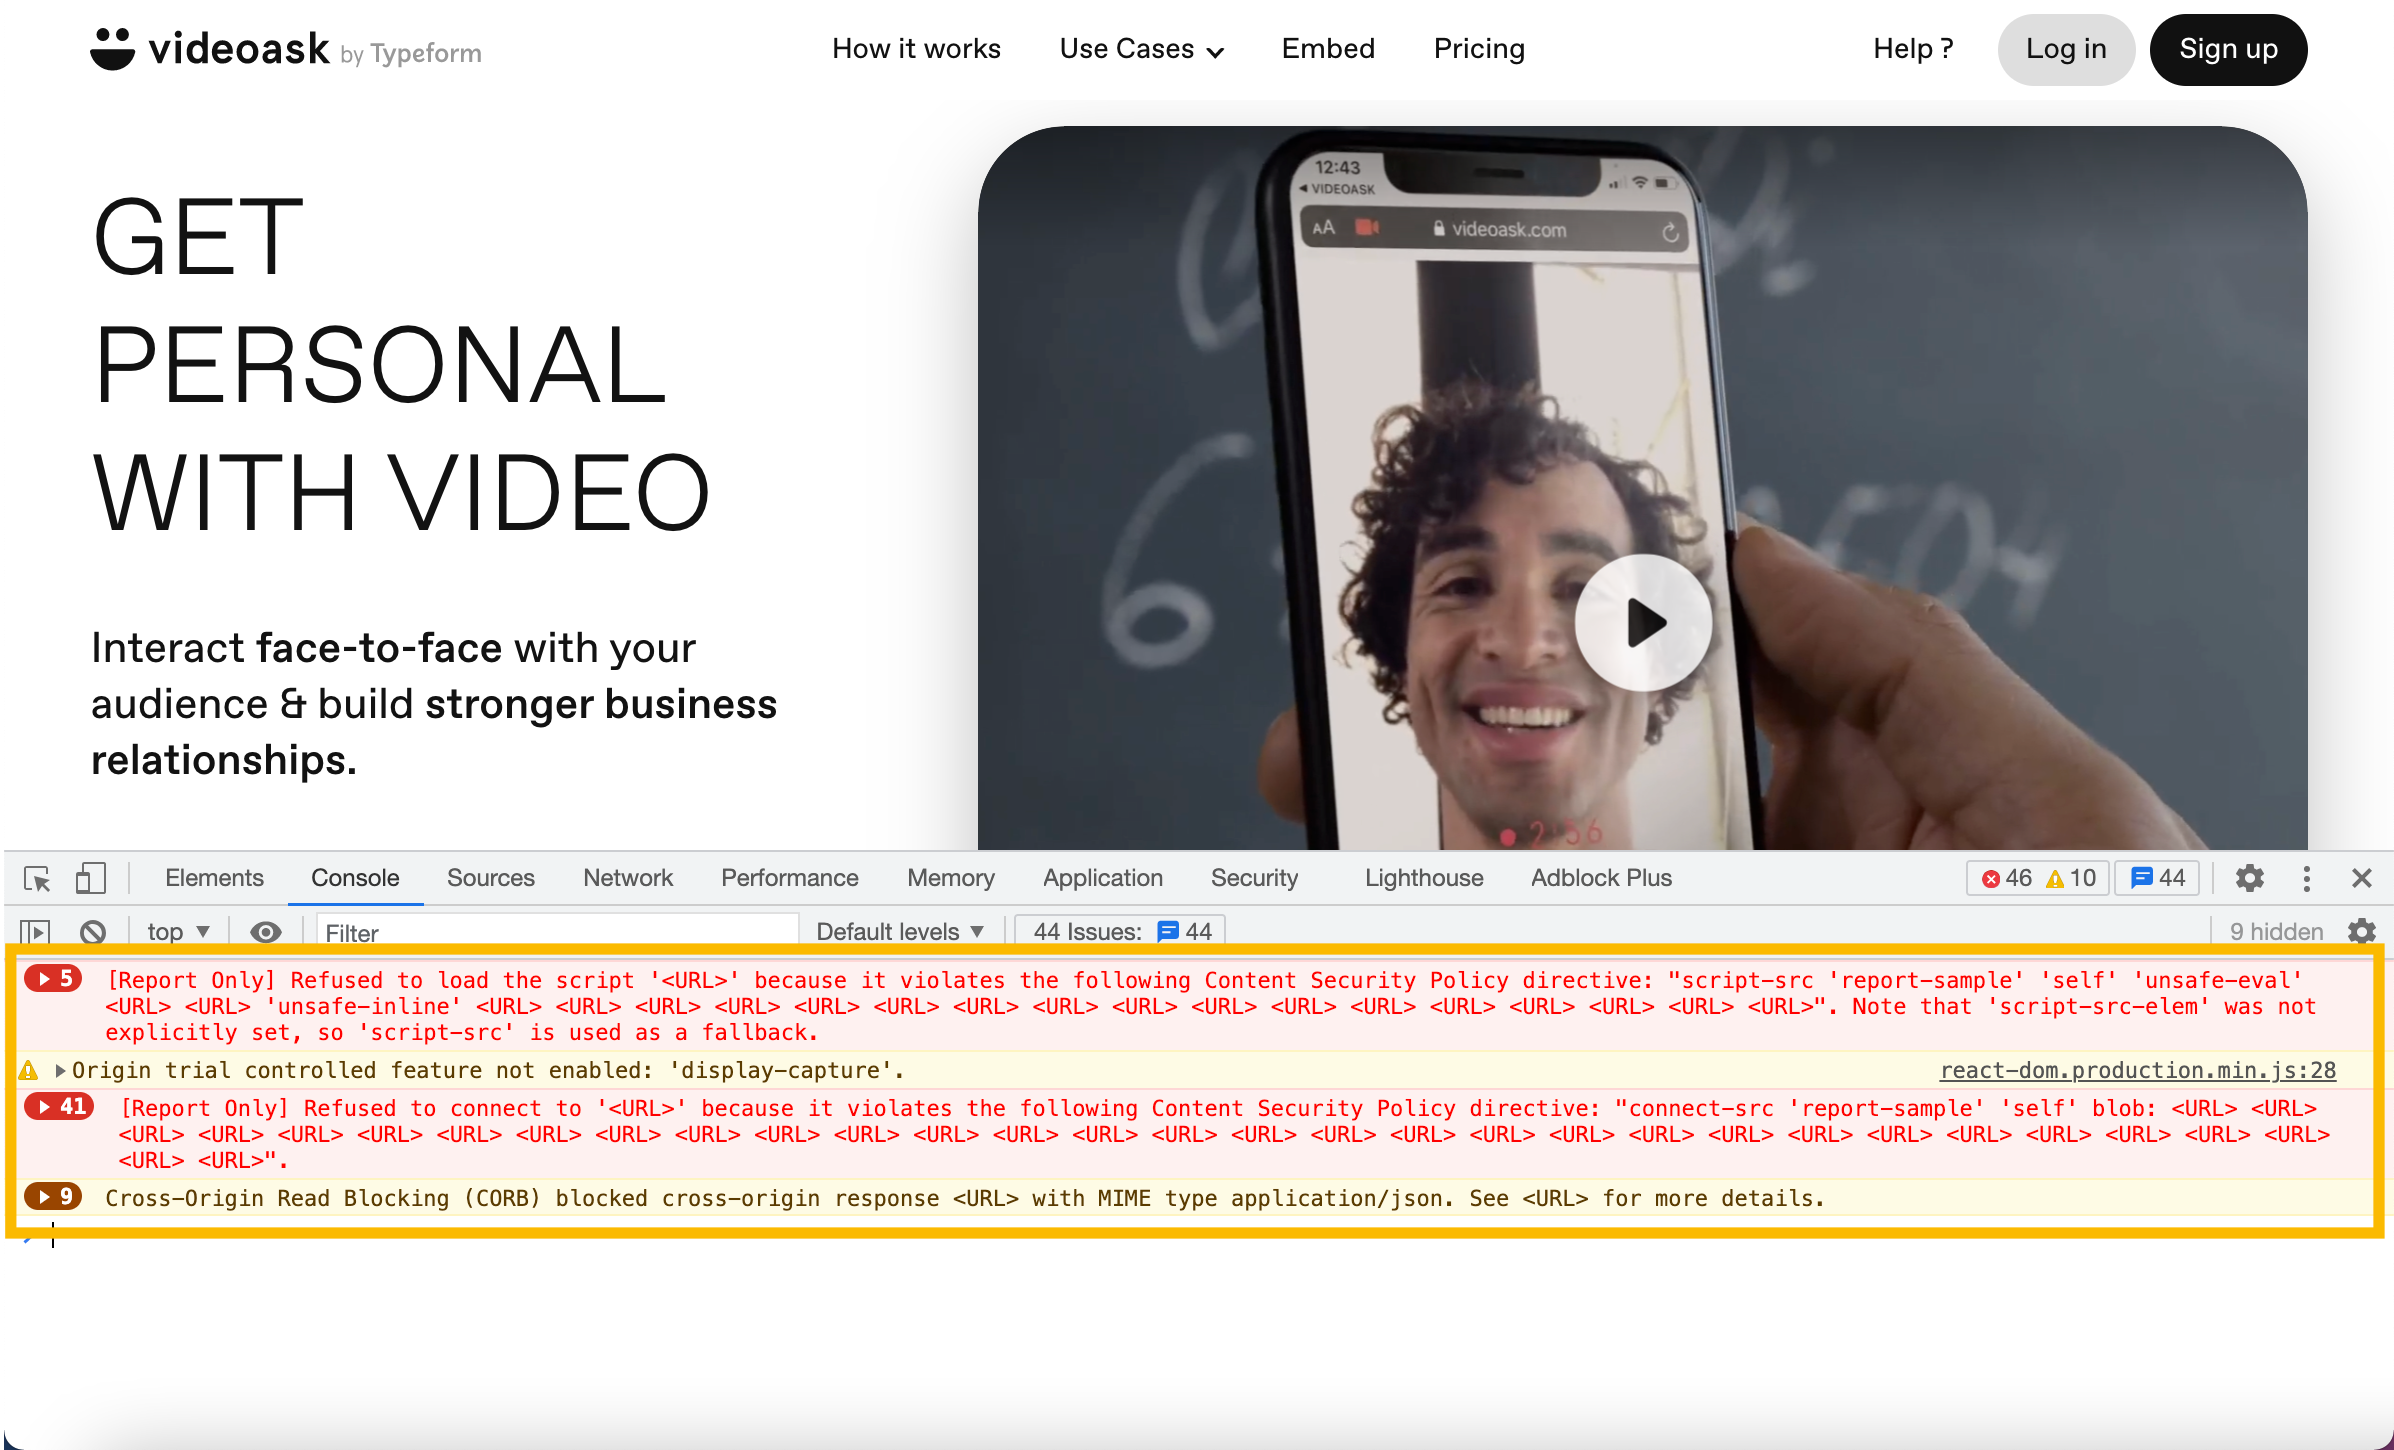
Take a screenshot or screen recording of the console window (make sure it includes the red error message).
Send it over to us along with your device information and our tech team will take a look to see where the issue is. 🙂
In Mozilla Firefox
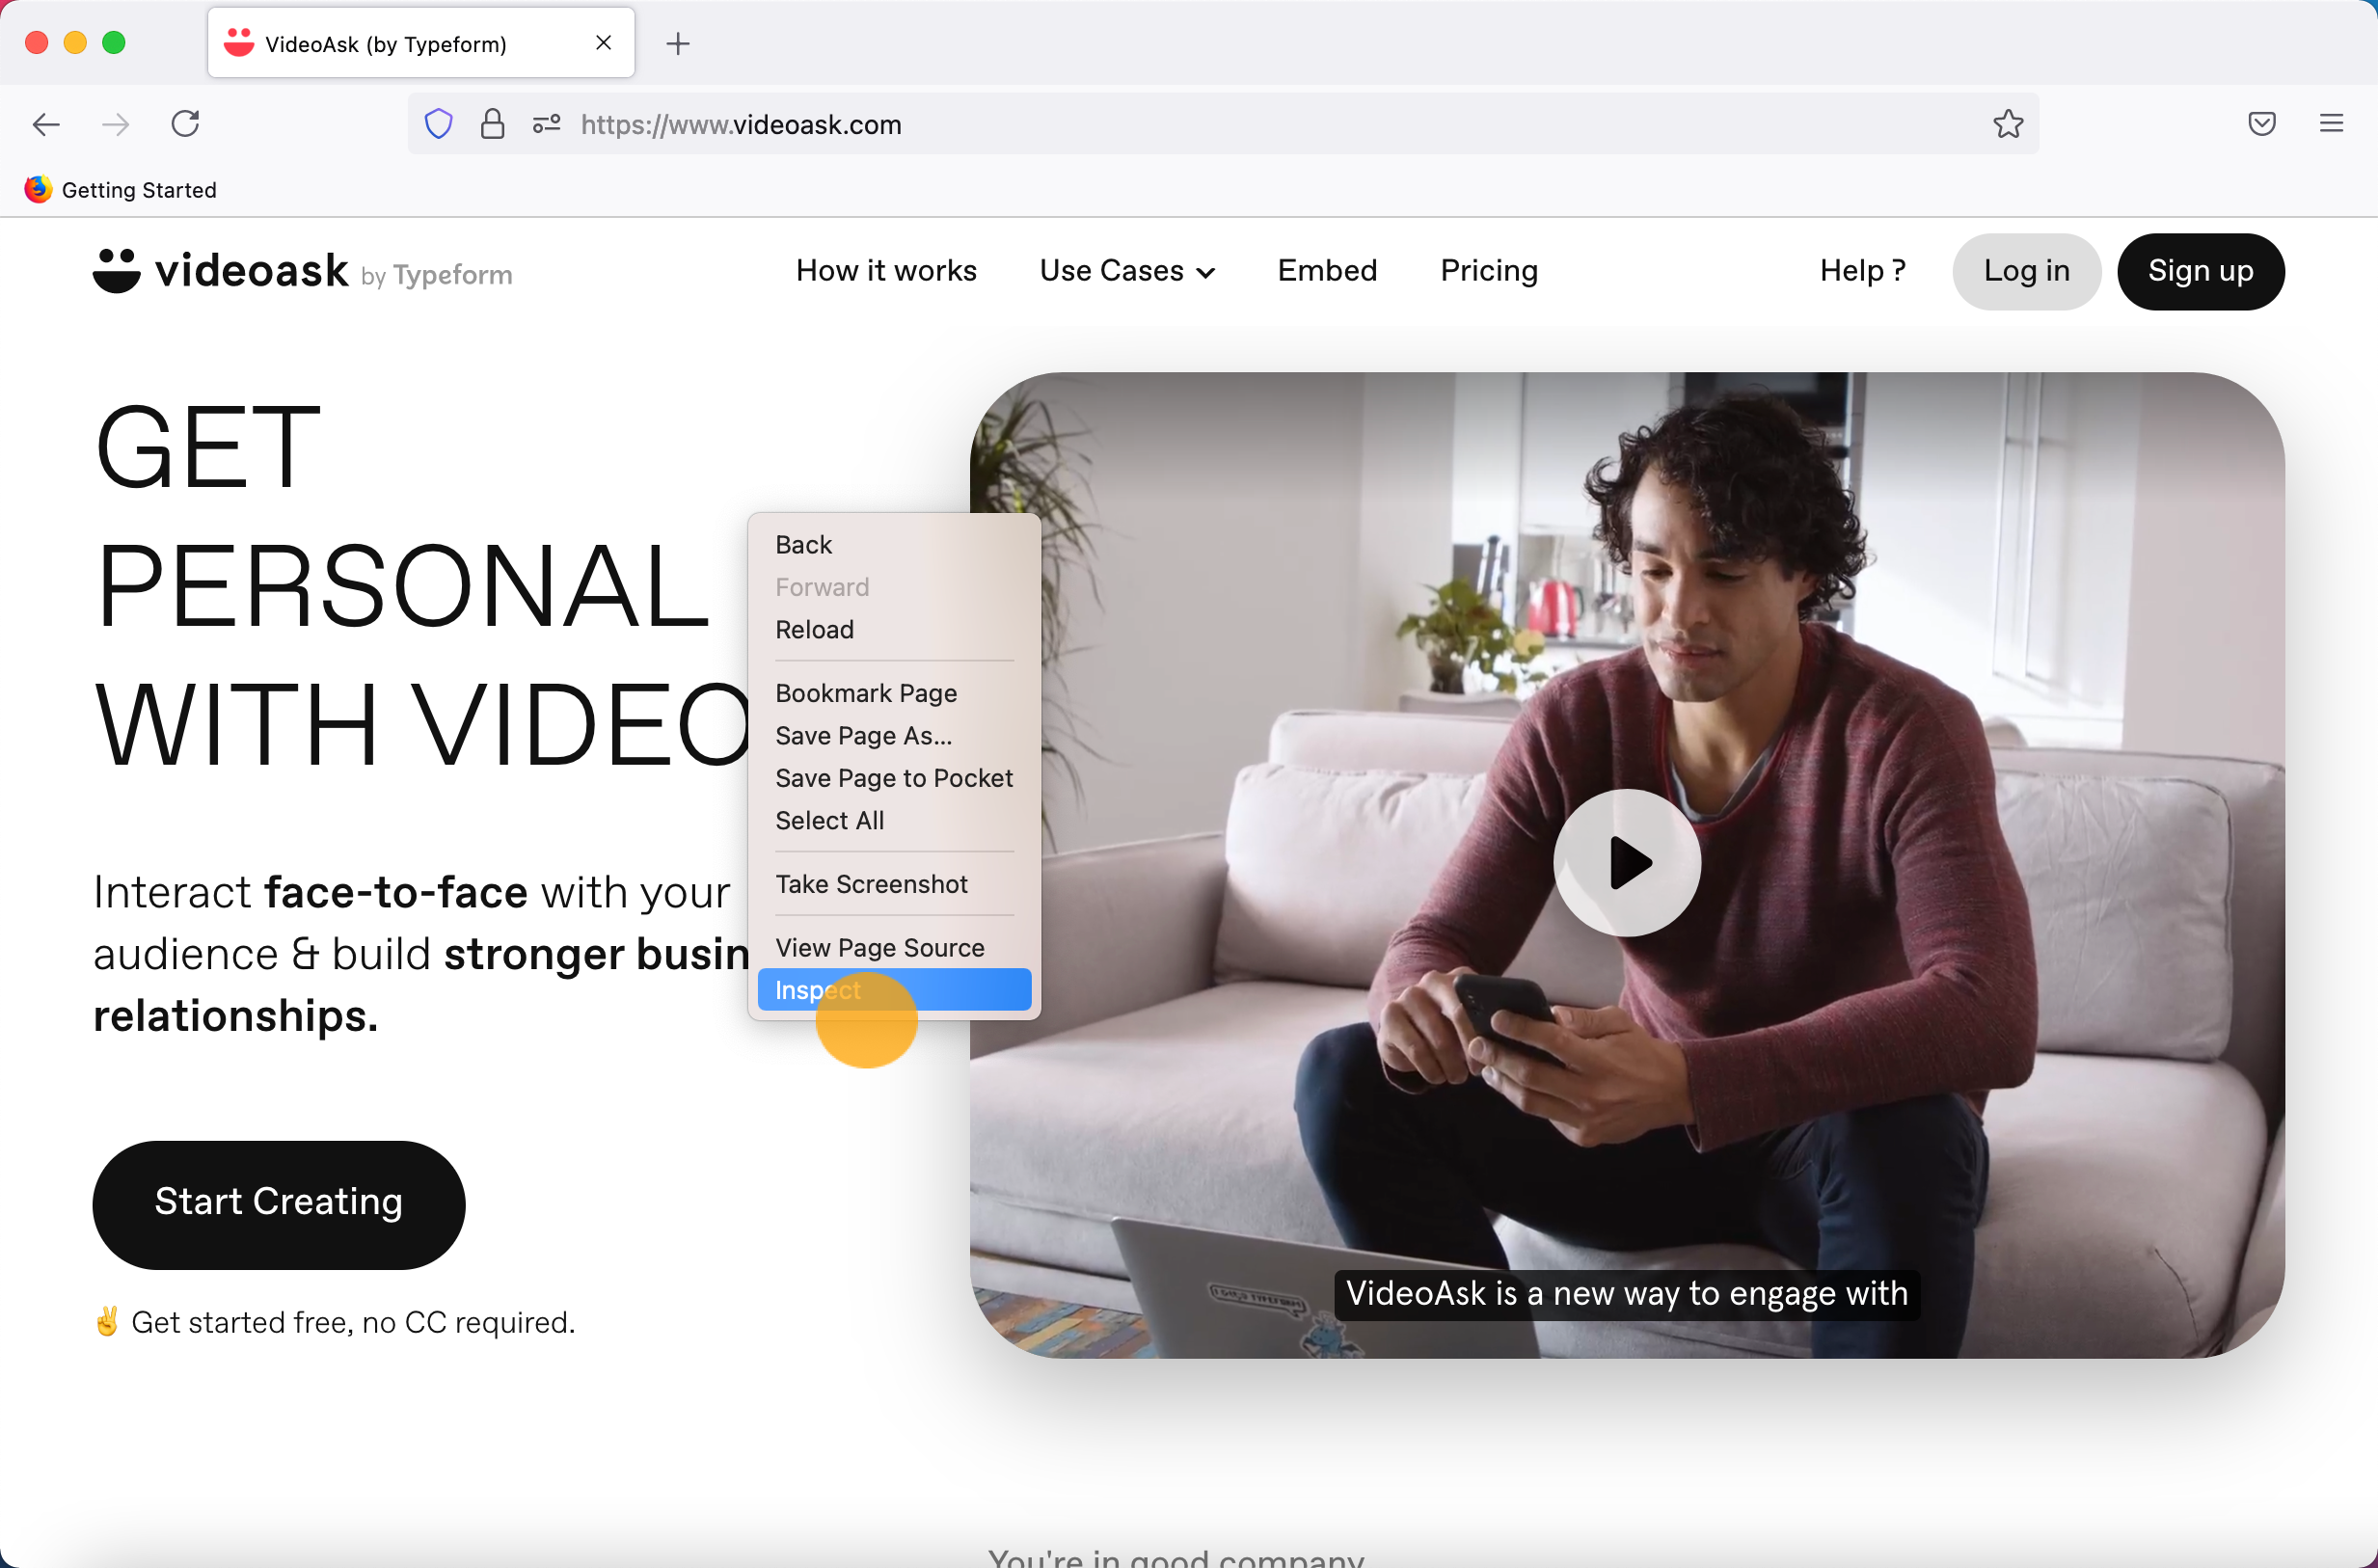
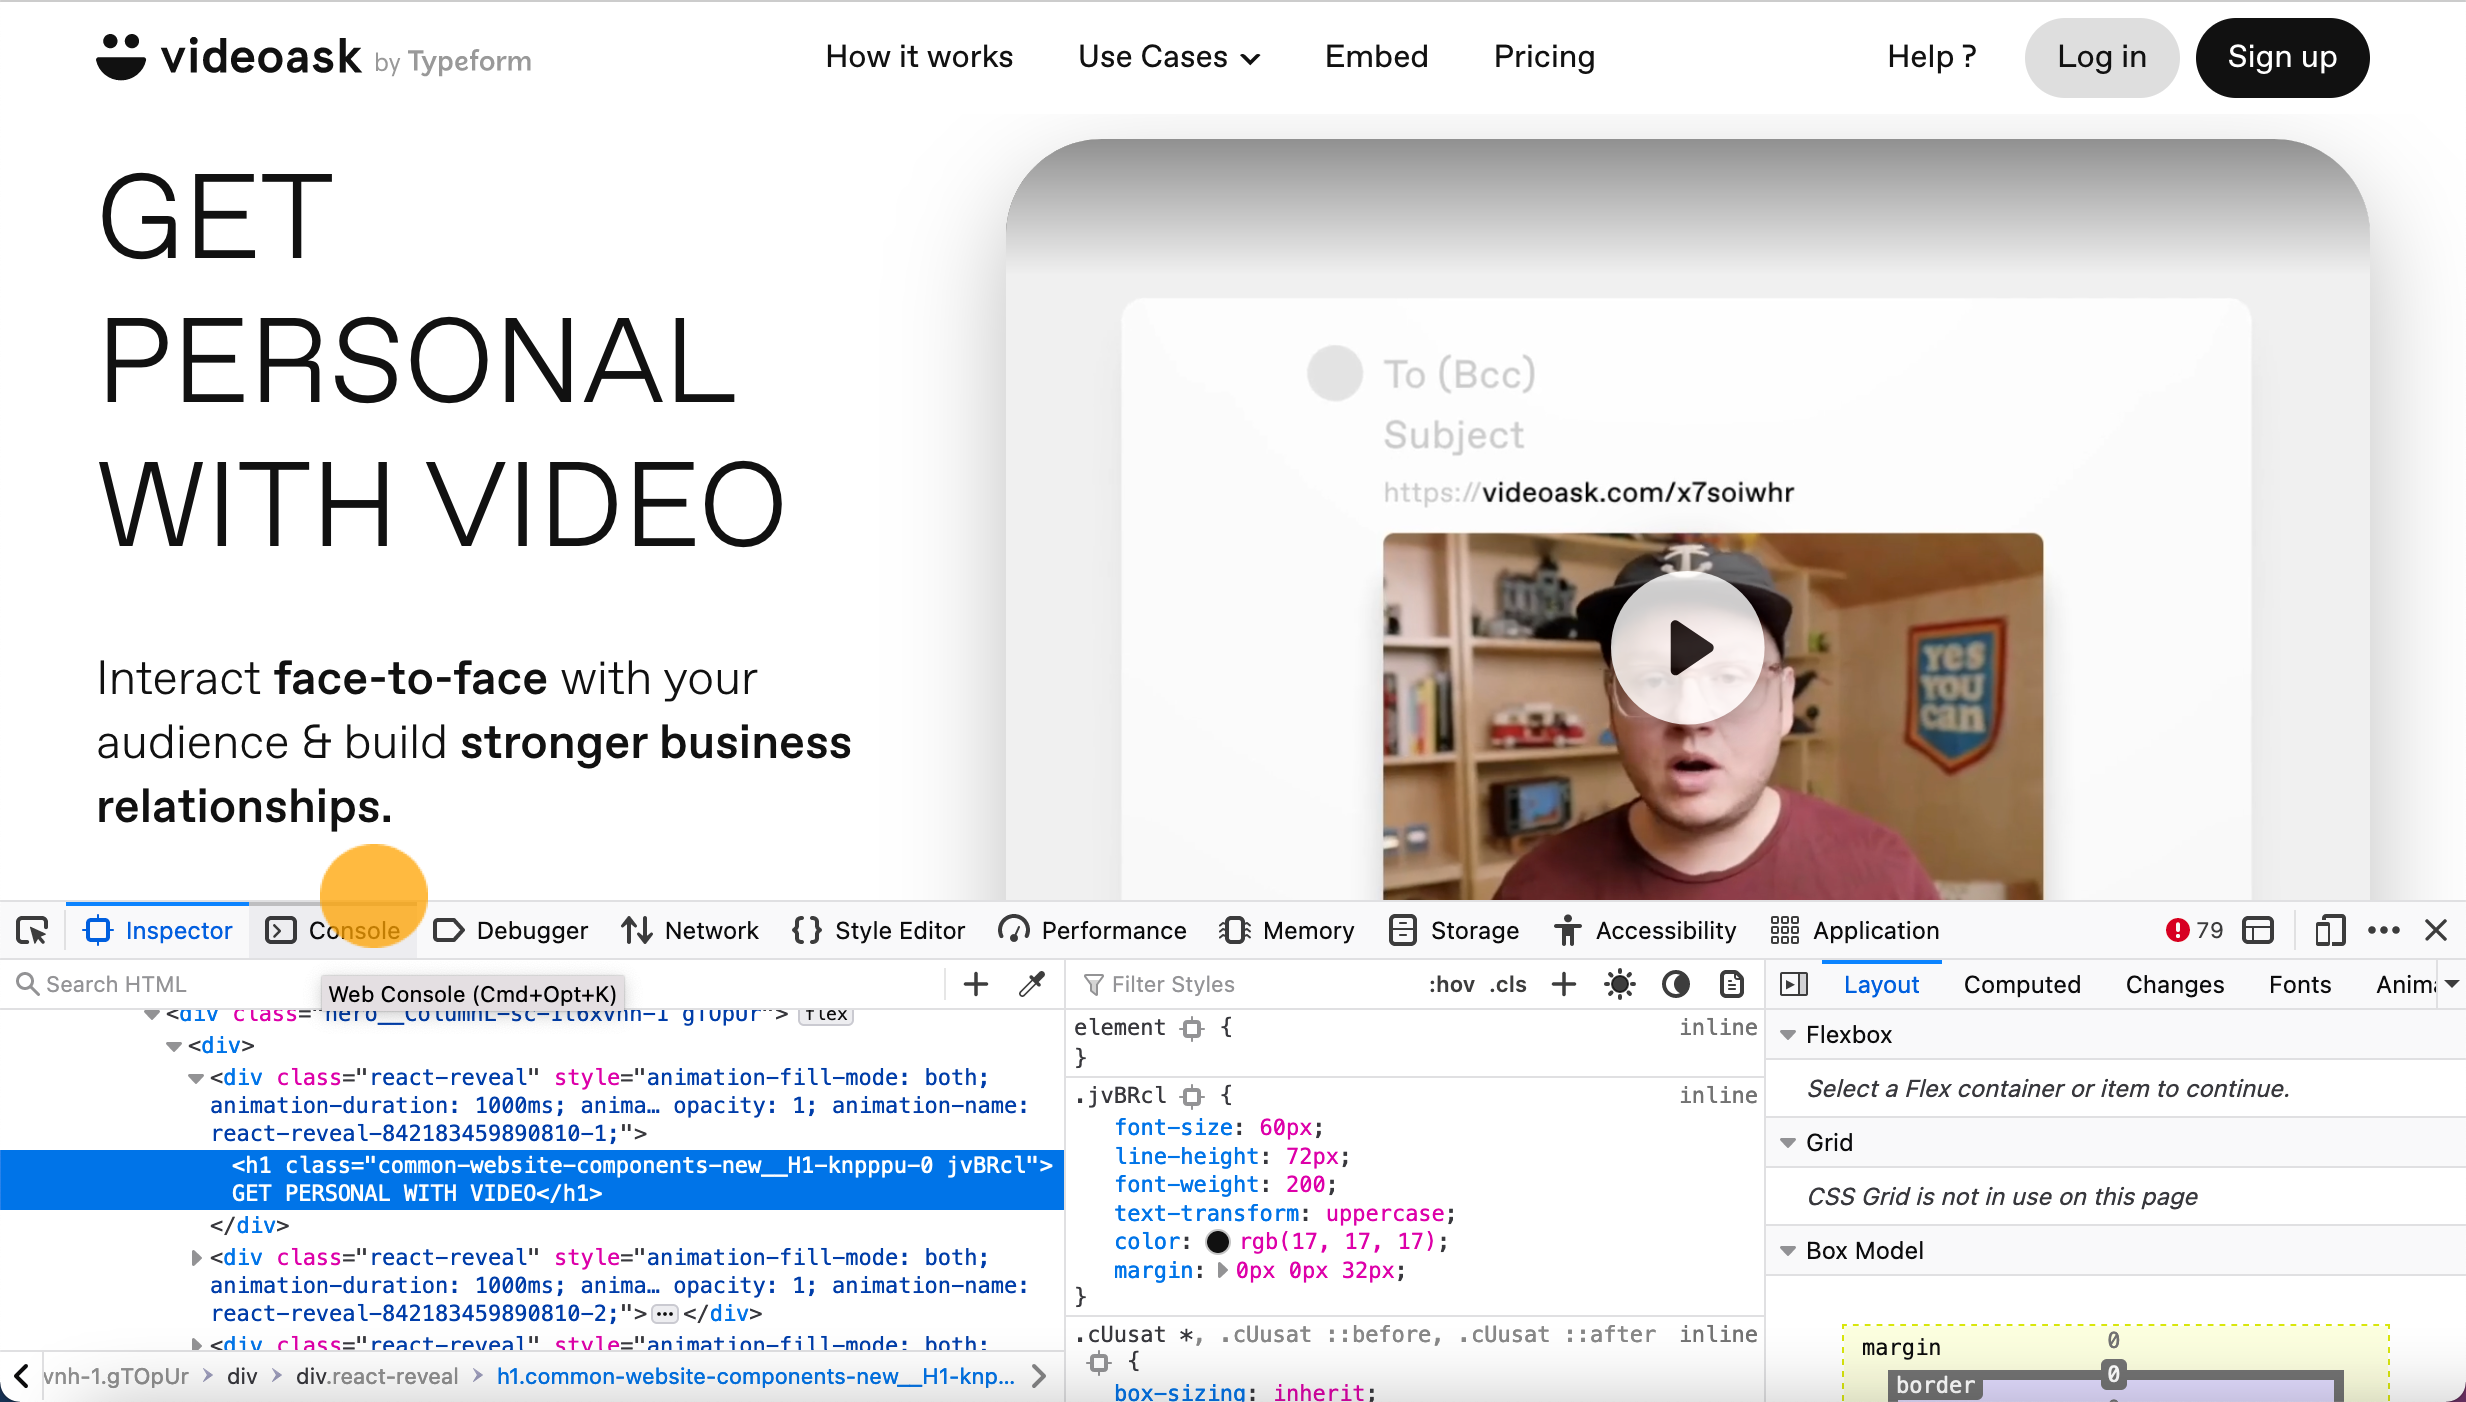
Right-click anywhere on the page where you're experiencing problems and select Inspect.
A window will appear at the bottom of your screen. Select the Console tab from the bar at the top of this window.
Note: You can also use the keyboard shortcut ⌘ + Opt + I (on Mac) or Ctrl + Shift + I (on Windows) to open the console.
Have another go at completing the action that hasn’t been working for you, this time with the developer console open. You should see an error message appear in red.
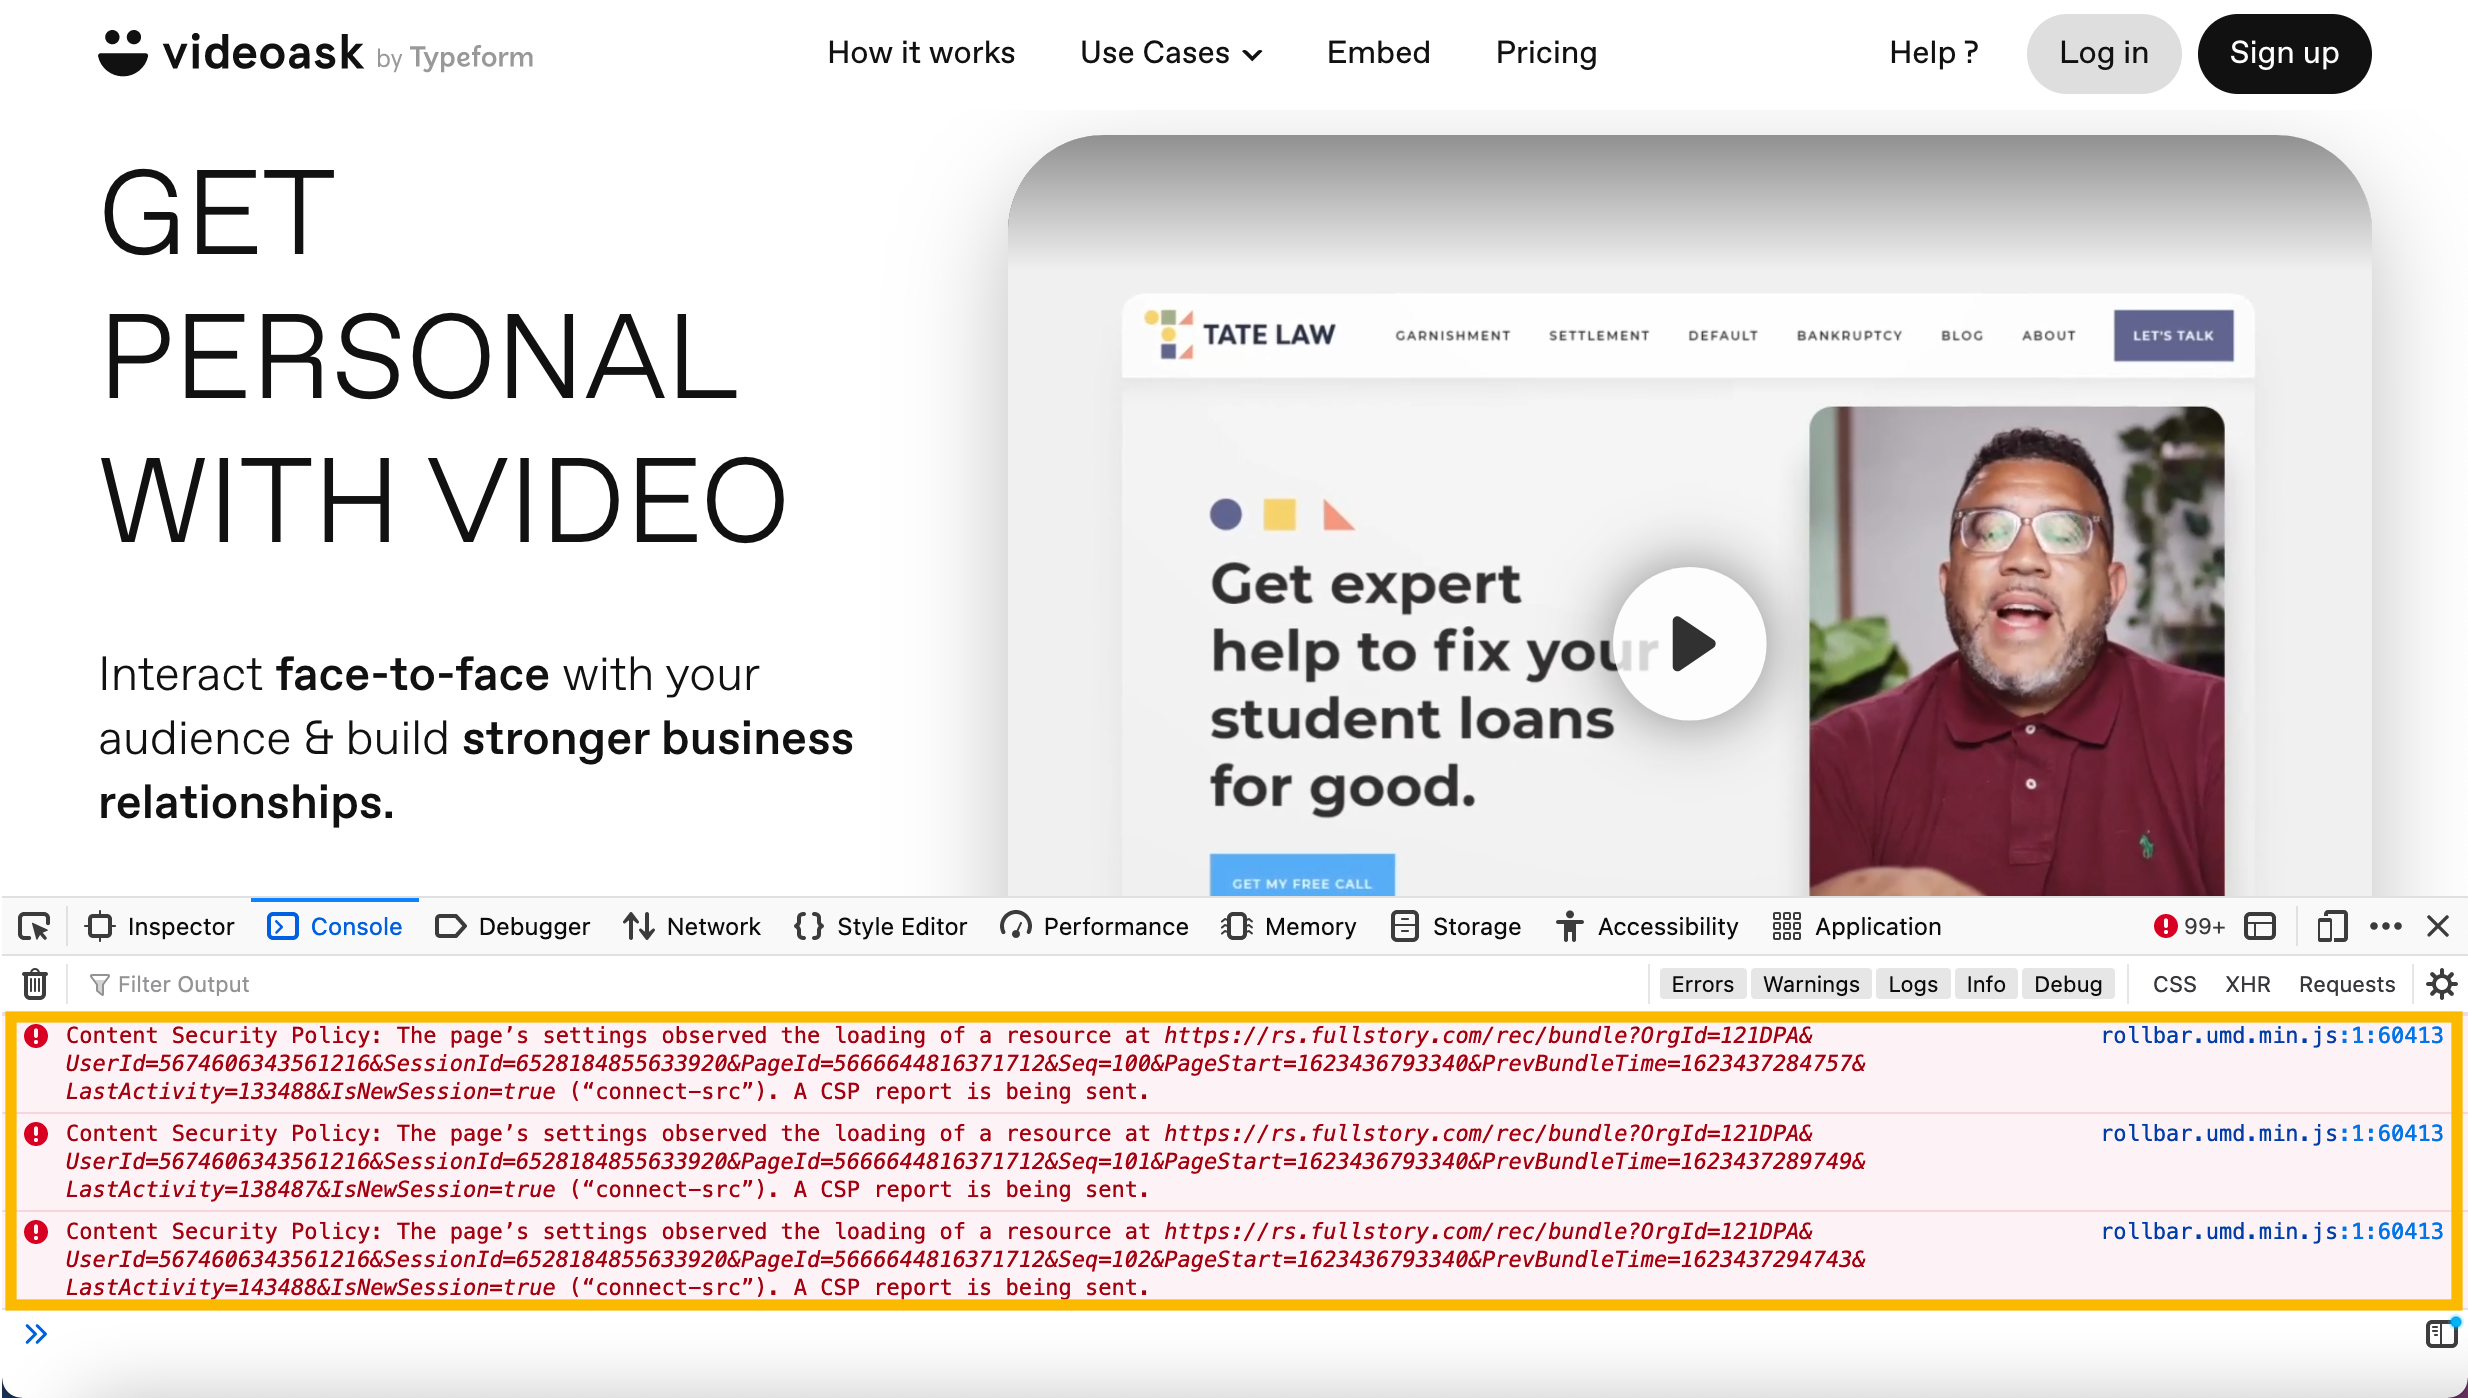
Take a screenshot or screen recording of the console window with the red error message.
Send it over to us with your device information and our tech team will take a look to see where the issue is. 🙂
In Safari
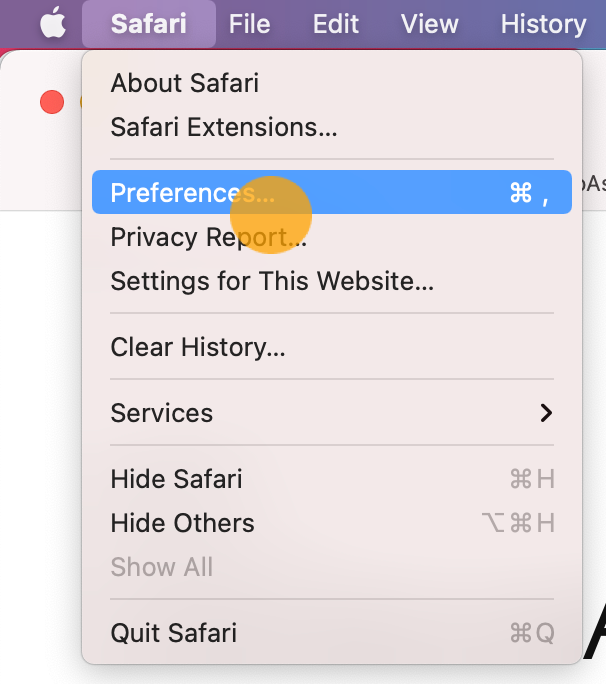
Select Safari and click Preferences.
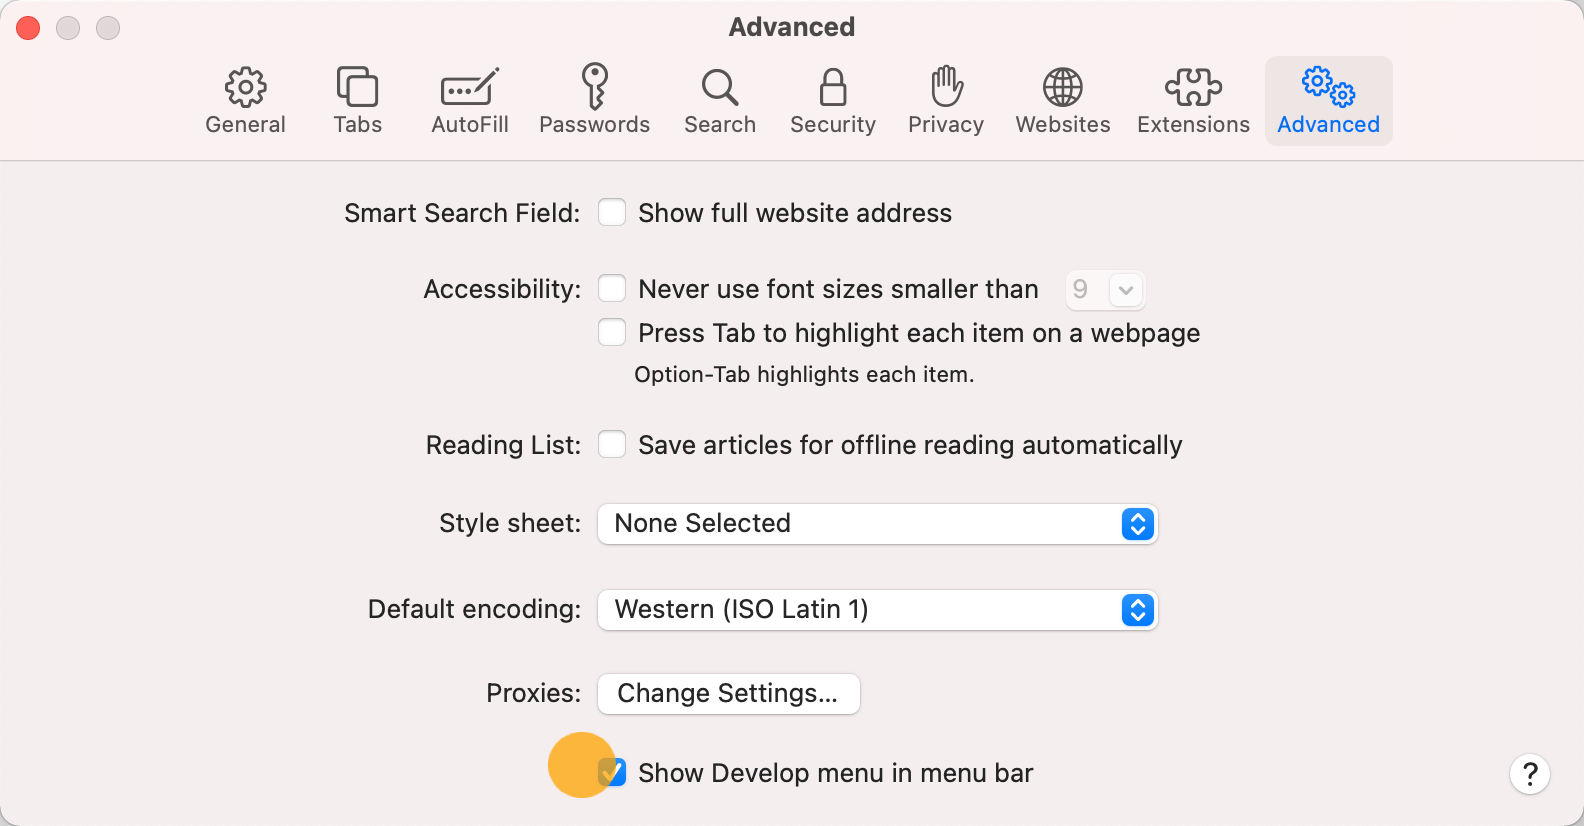
Under the Advanced section of your browser settings, make sure Show Develop menu in menu bar is enabled
Once the Develop menu is enabled, you can find the developer console by clicking Develop and Show Javascript Console.
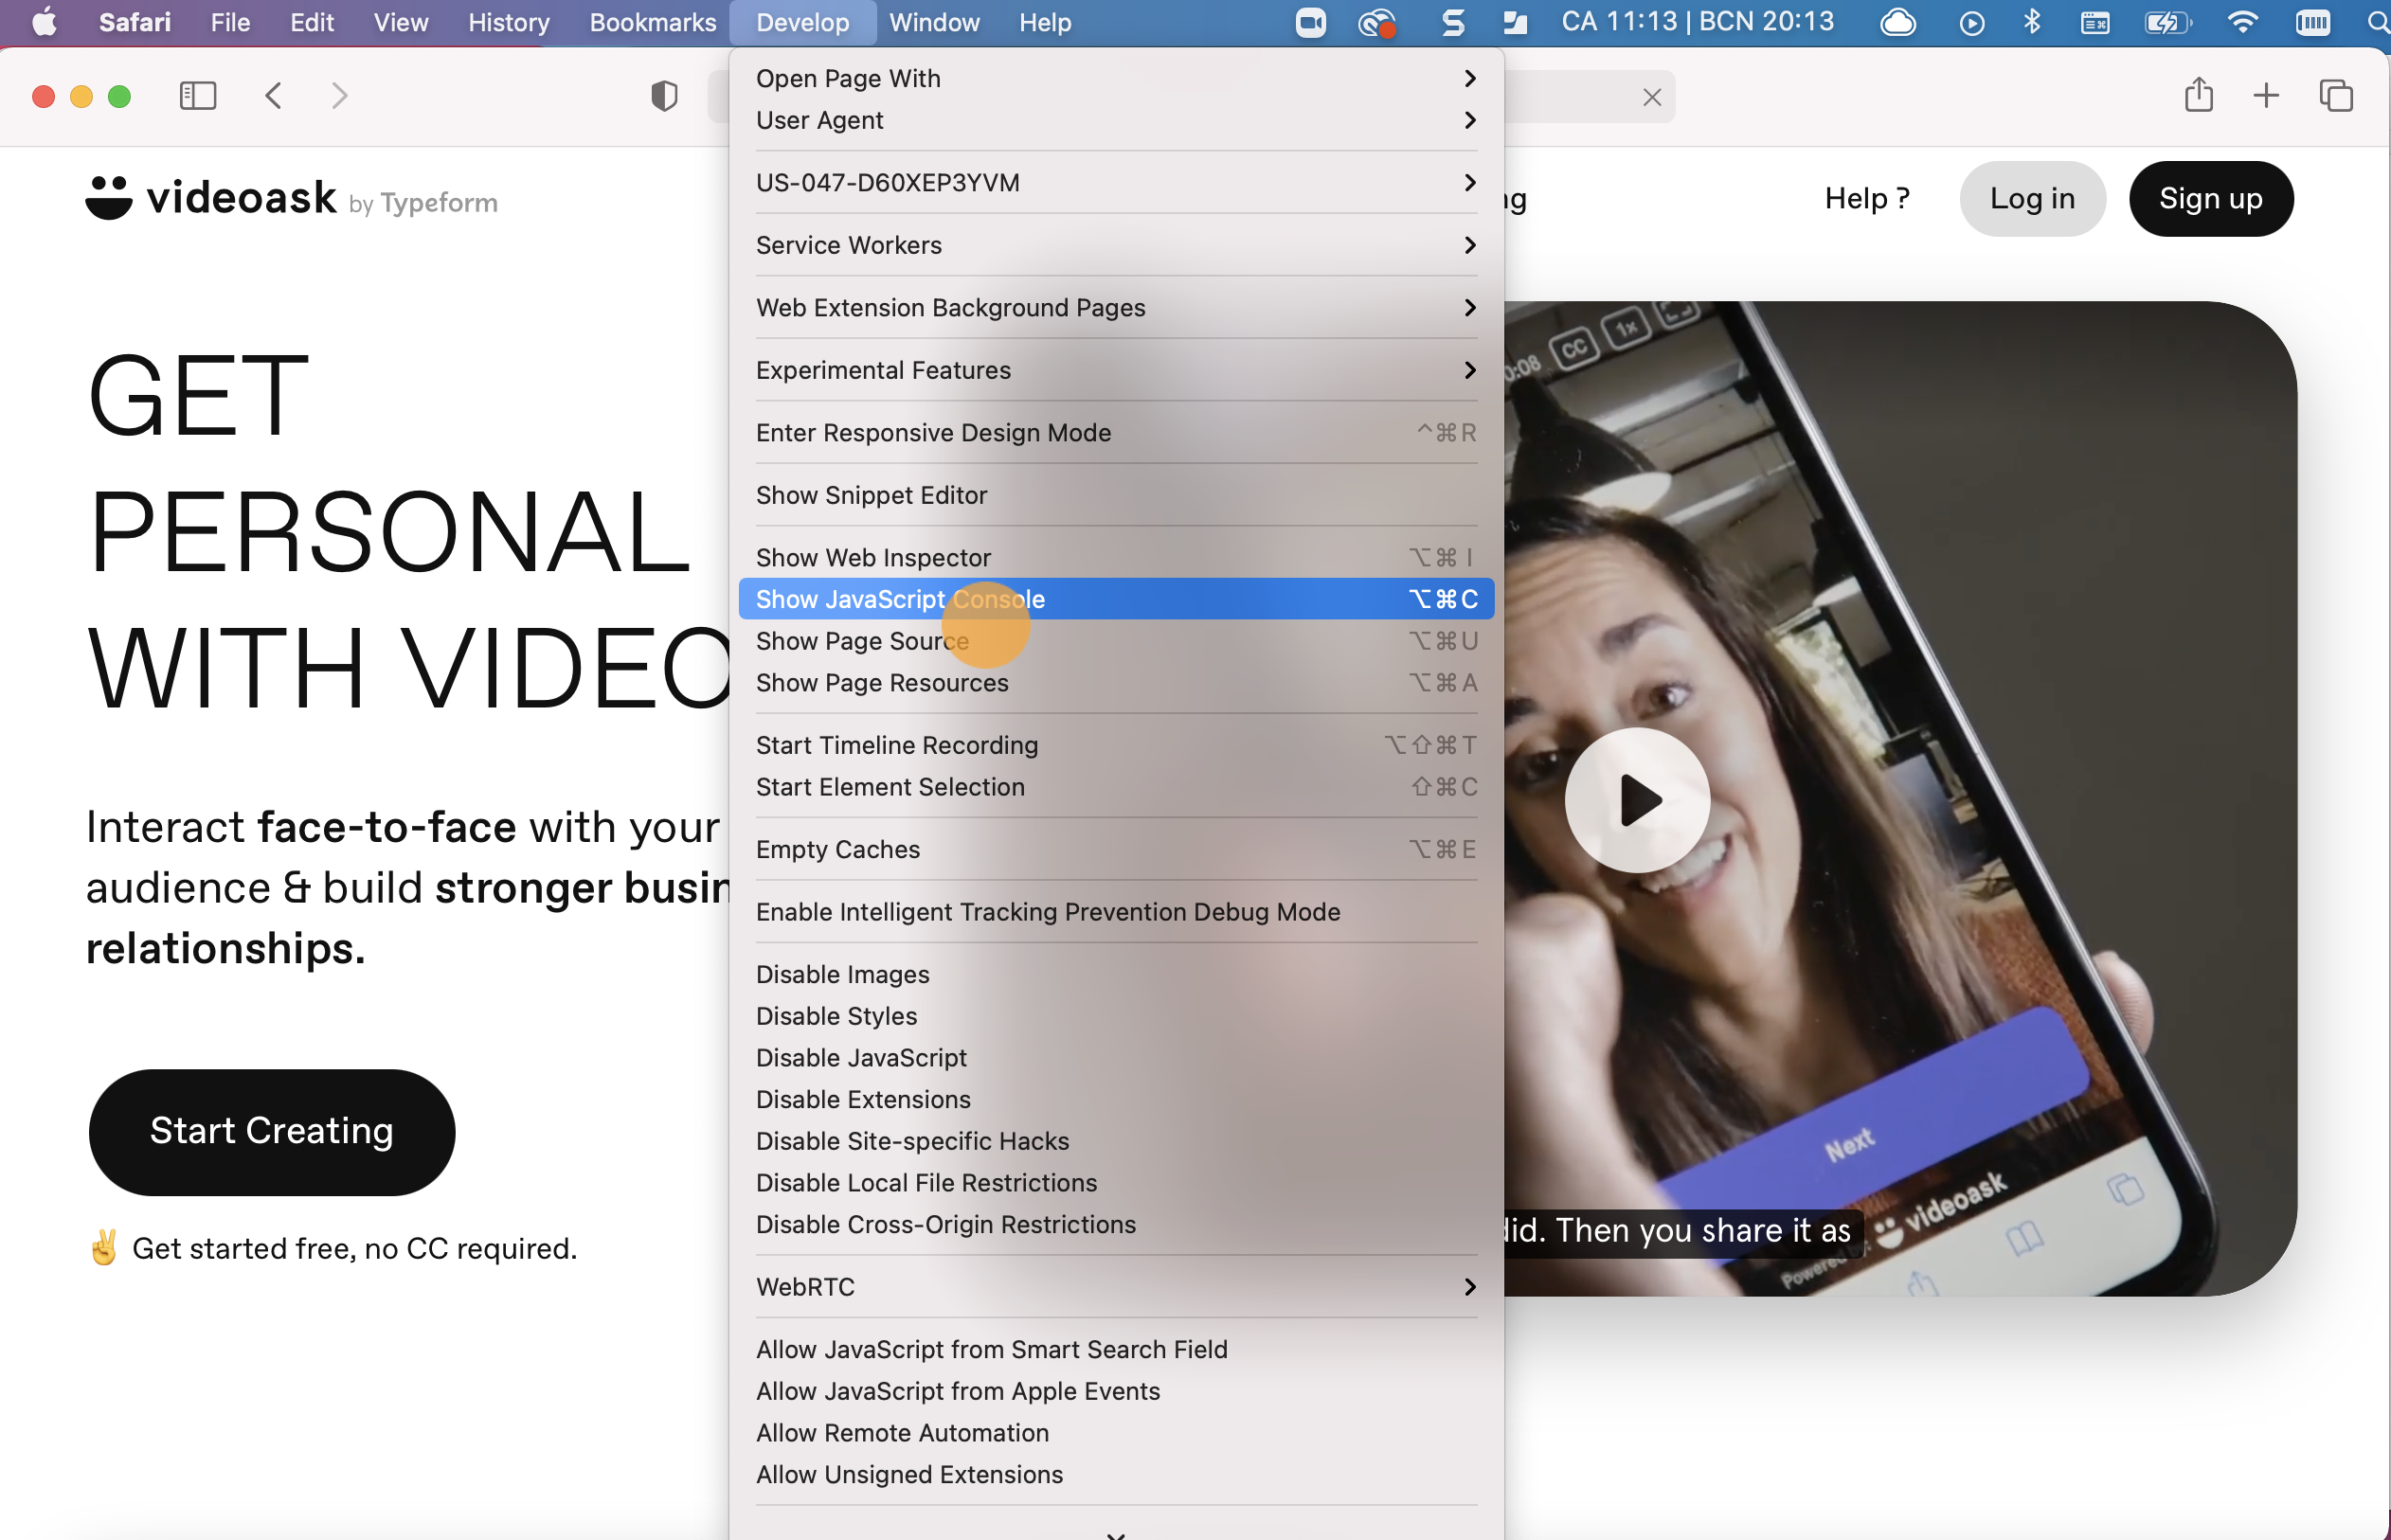
Note: You can also open the console with the keyboard shortcut Option + ⌘ + C.
The developer console window will appear at the bottom of your screen. Have another go at completing the action that hasn’t been working for you with the developer console open. You should see an error message appear in red.
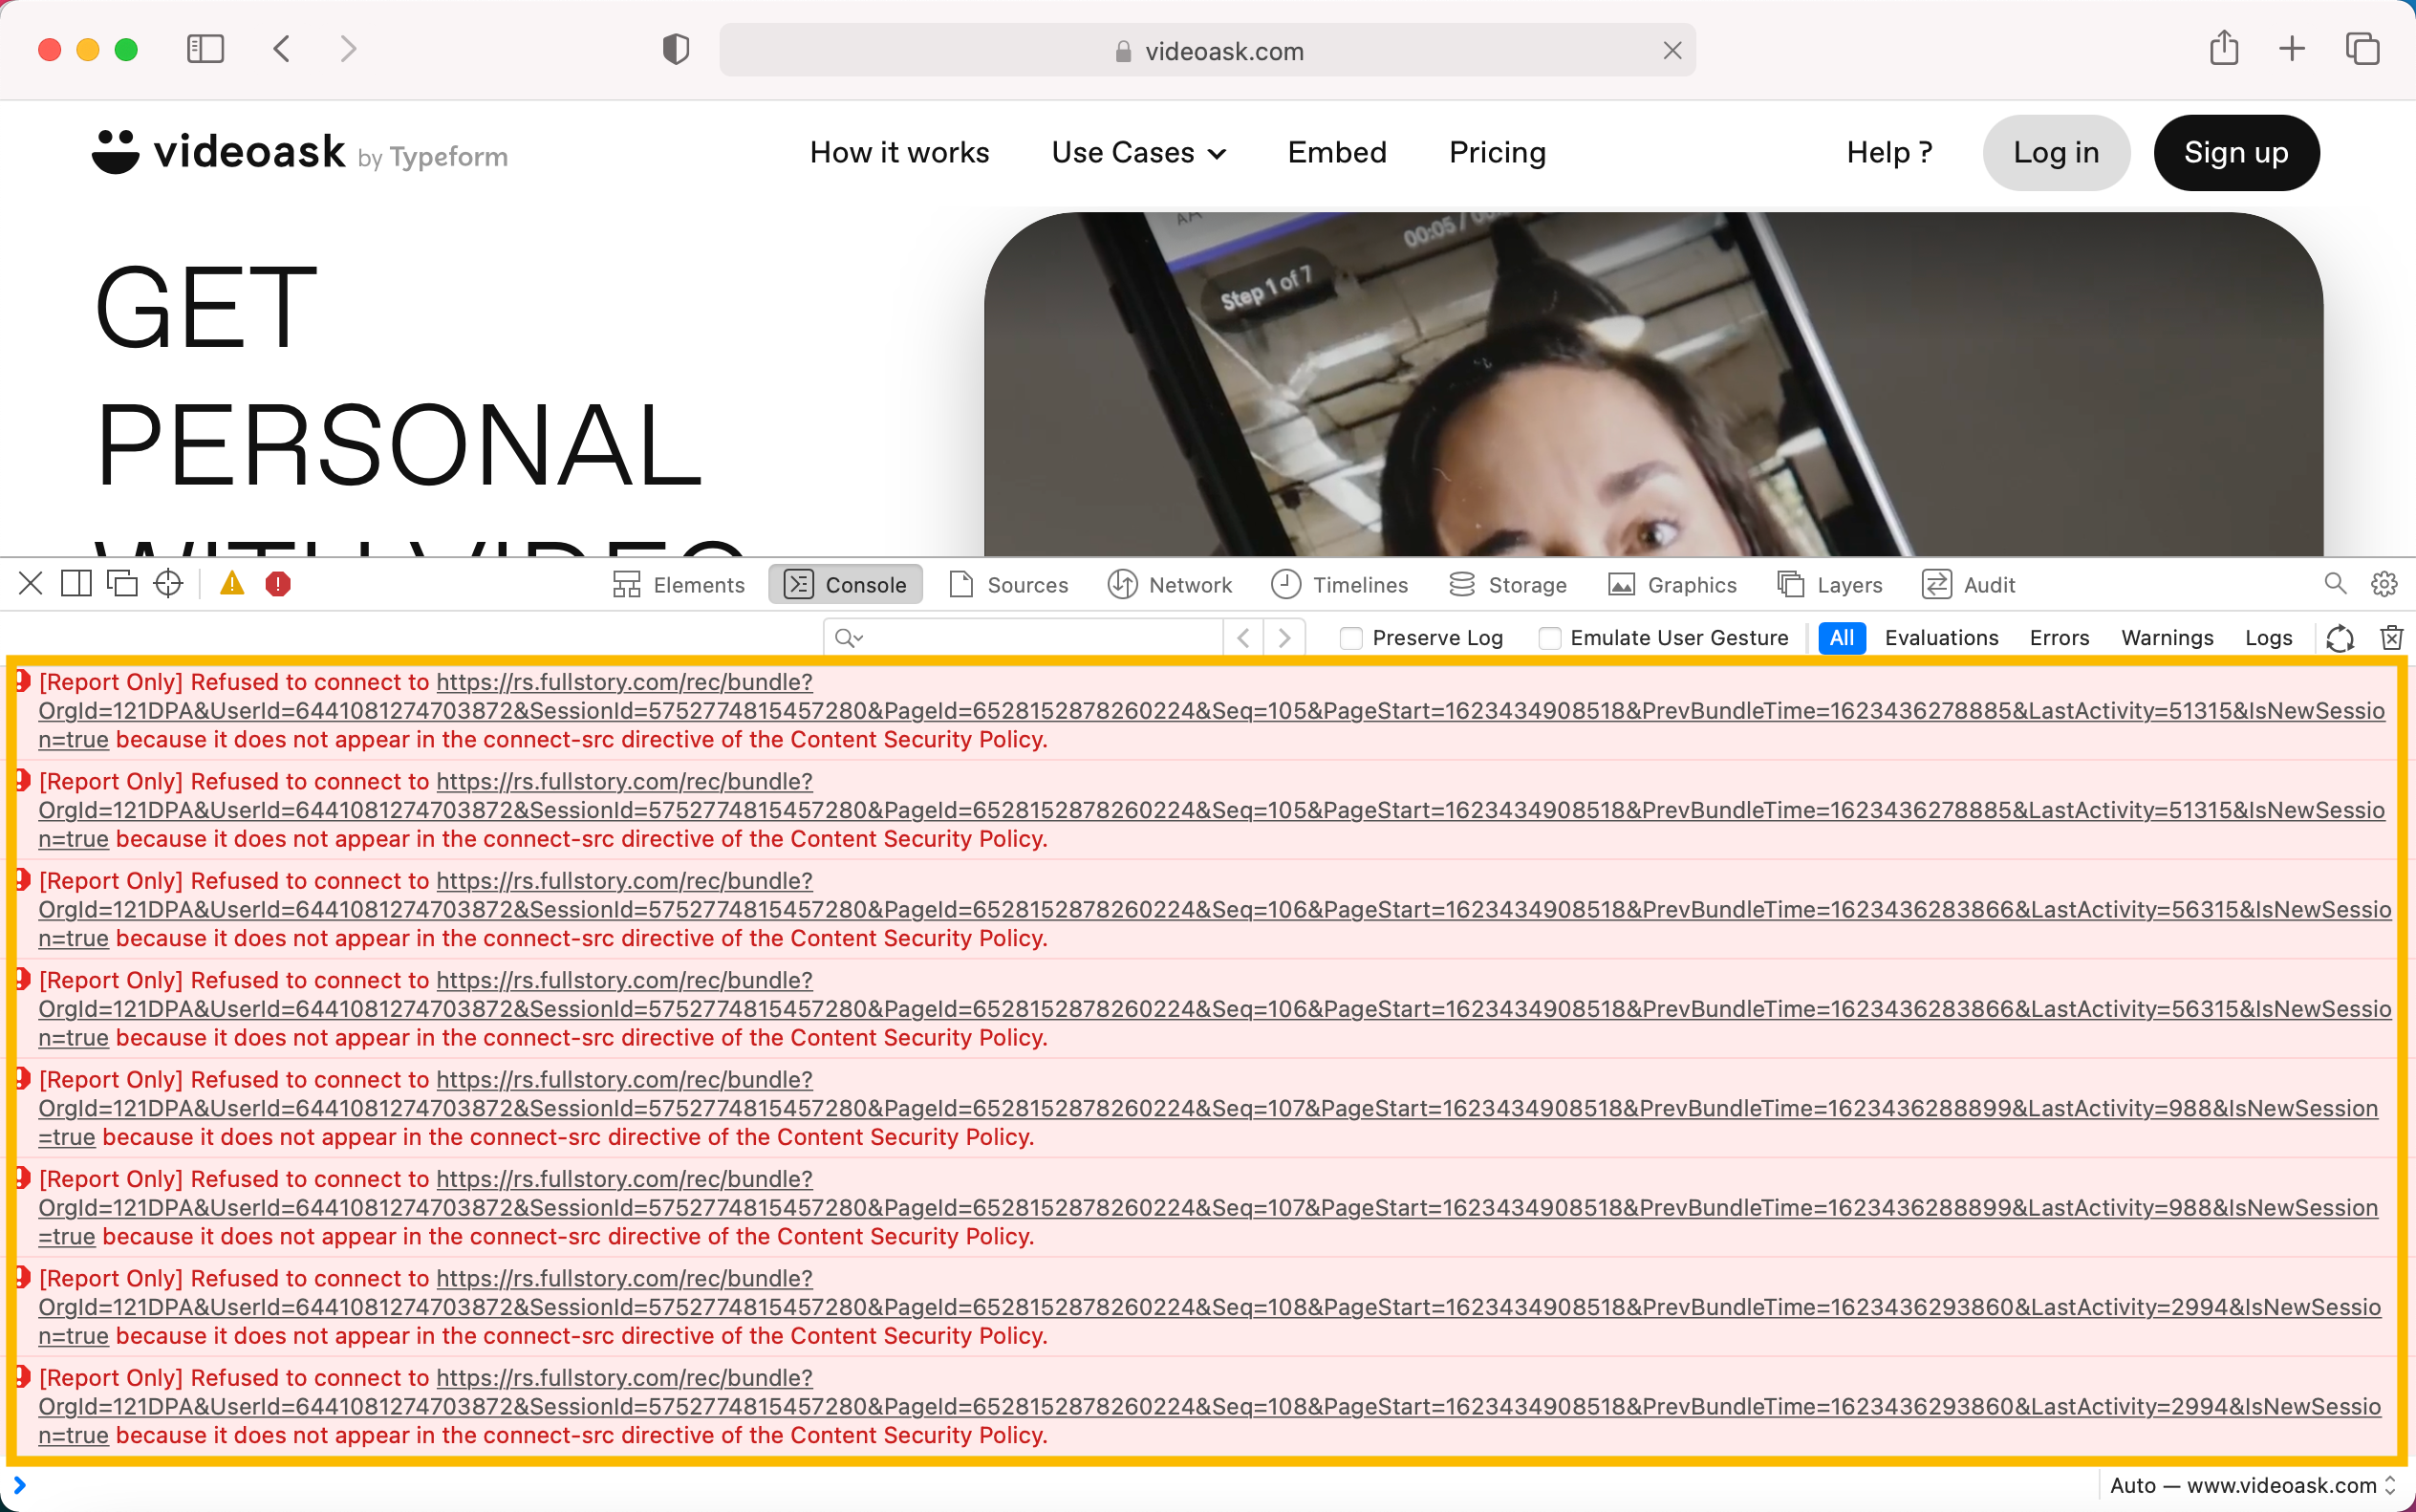
Take a screenshot or screen recording of the console window (make sure it includes the red error message).
Send it over to us along with your device information and our tech team will take a look to see where the issue is. 🙂
What's the best information I can provide so a bug or problem is resolved as quickly as possible?
The more information our engineers have, the quicker they'll be able to isolate and resolve the problem you're experiencing (assuming the problem is being caused by something that's in our control 😅).
To help speed along the process, whenever possible, please let us know:
- Device being used and operating system version
- Browser being used and its version
- What steps you've taken prior to encountering an issue