Now that you've shared your videoask with the world, you may be wondering how well it's performing. There are a number of different types of data you can dive into to see how engaging your videoask is and how to optimize it.
Some options are built directly into your videoask inbox or builder. Others will require a data export or connecting to external tools...let's explore how to find the right type of data for you!
Jump to:
View your videoask engagement metrics
If you want to find out more about how respondents interacted with your videoask over a certain timeframe or on a particular device, this can be found in the Metrics tab of your inbox. If you're looking for a breakdown of stats per step, head to the Results tab of your inbox.
If this isn't quite what you're looking for, drop-off analysis gives you a detailed look into where people are abandoning your multi-step videoask.
View your videoask engagement metrics
Note: You must have received at least one submission to your videoask in order to be able to view the metrics. If you haven't yet received any submissions, but want to check if people have landed on (but not interacted with) the first step of your videoask, check out the drop-off analysis.
Select a videoask that has received responses and click the Metrics tab.
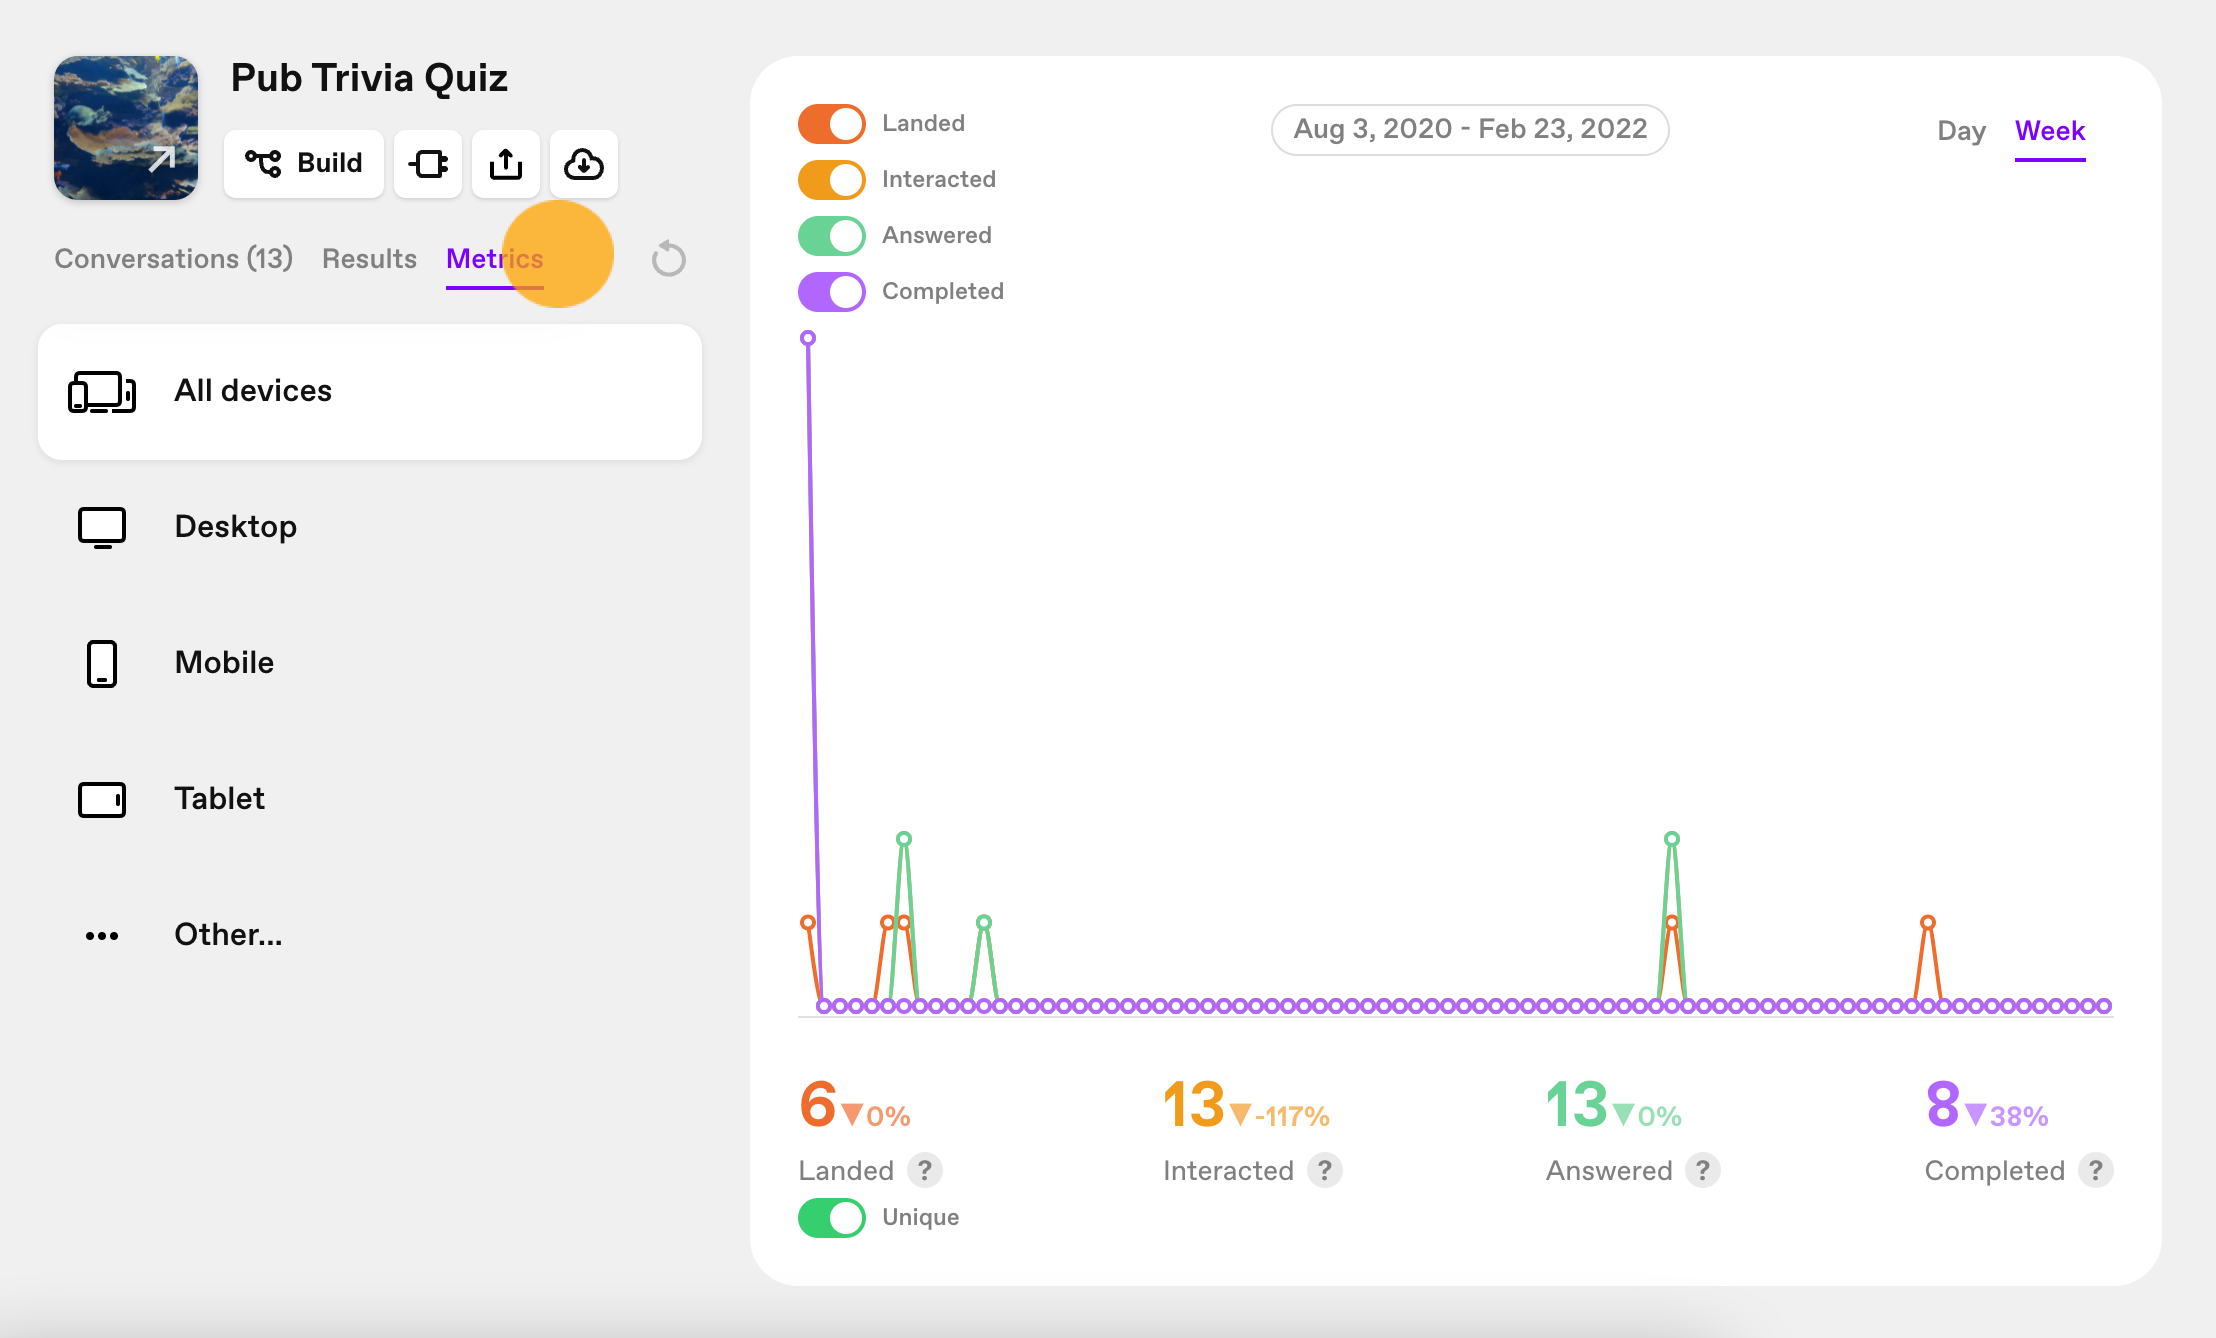
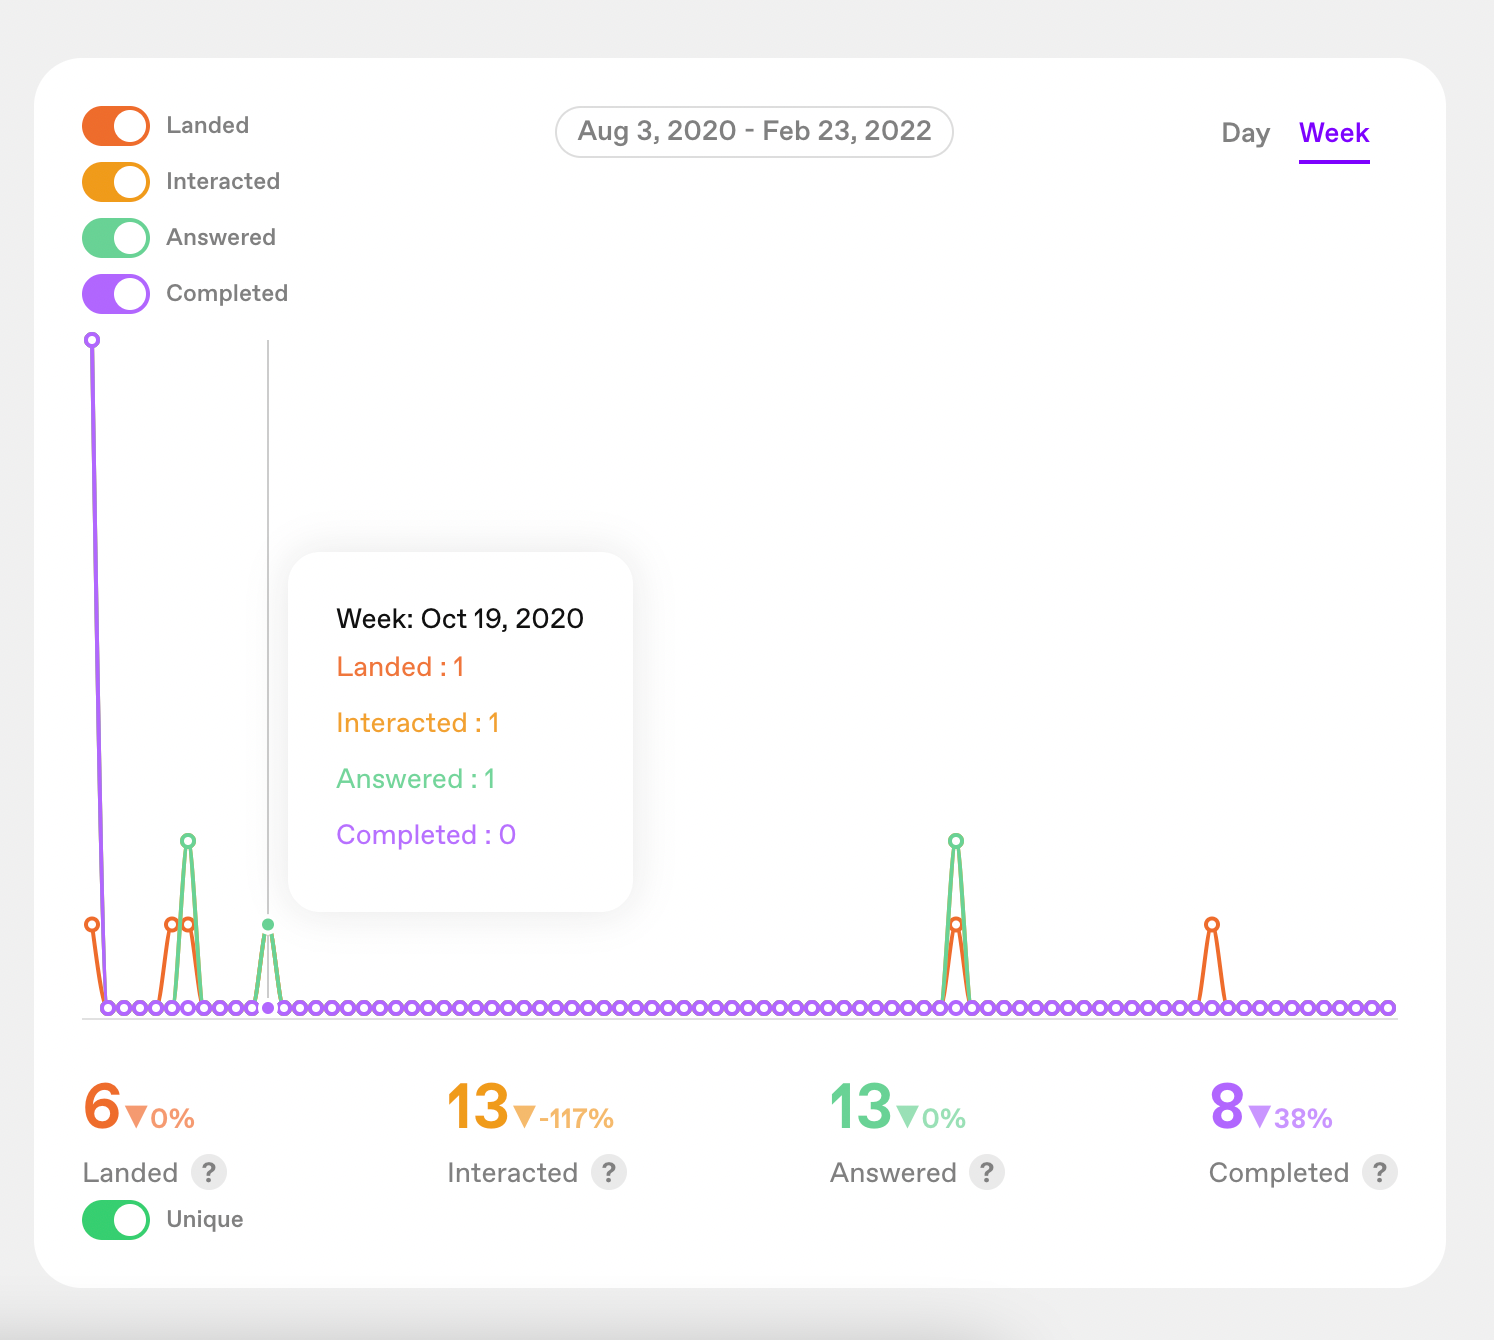
Hover over the graph to view stats per week.
Here are some examples of what you can see in the Metrics section:
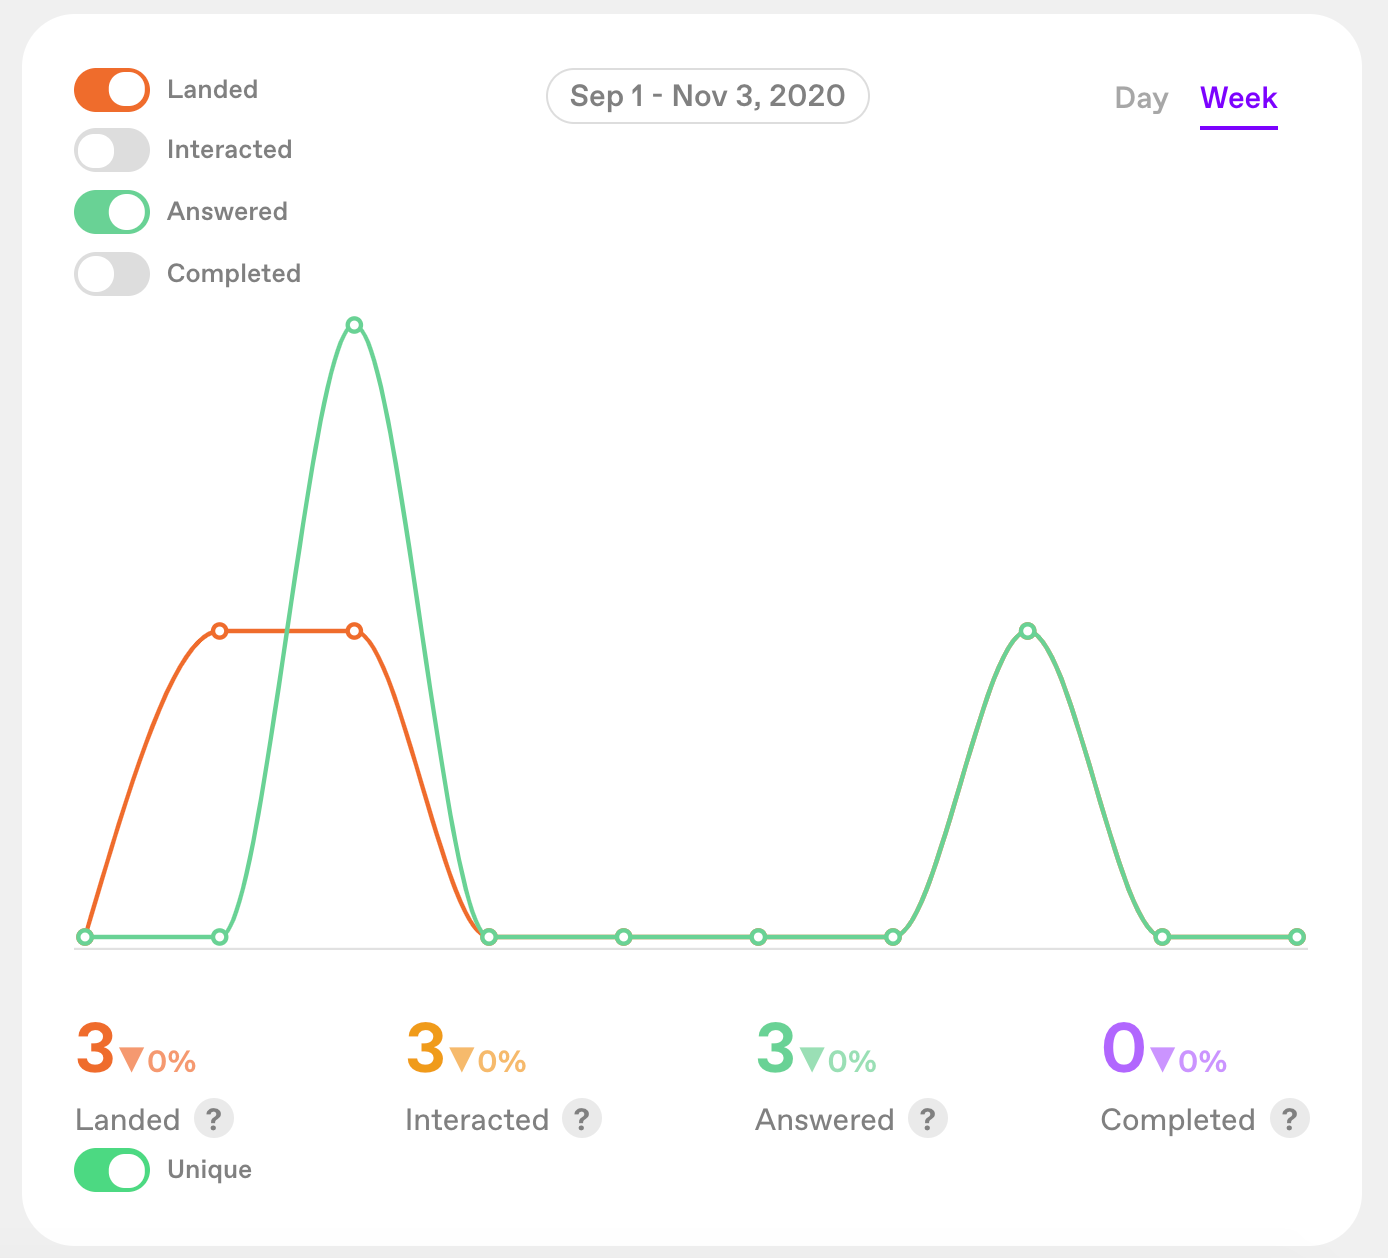
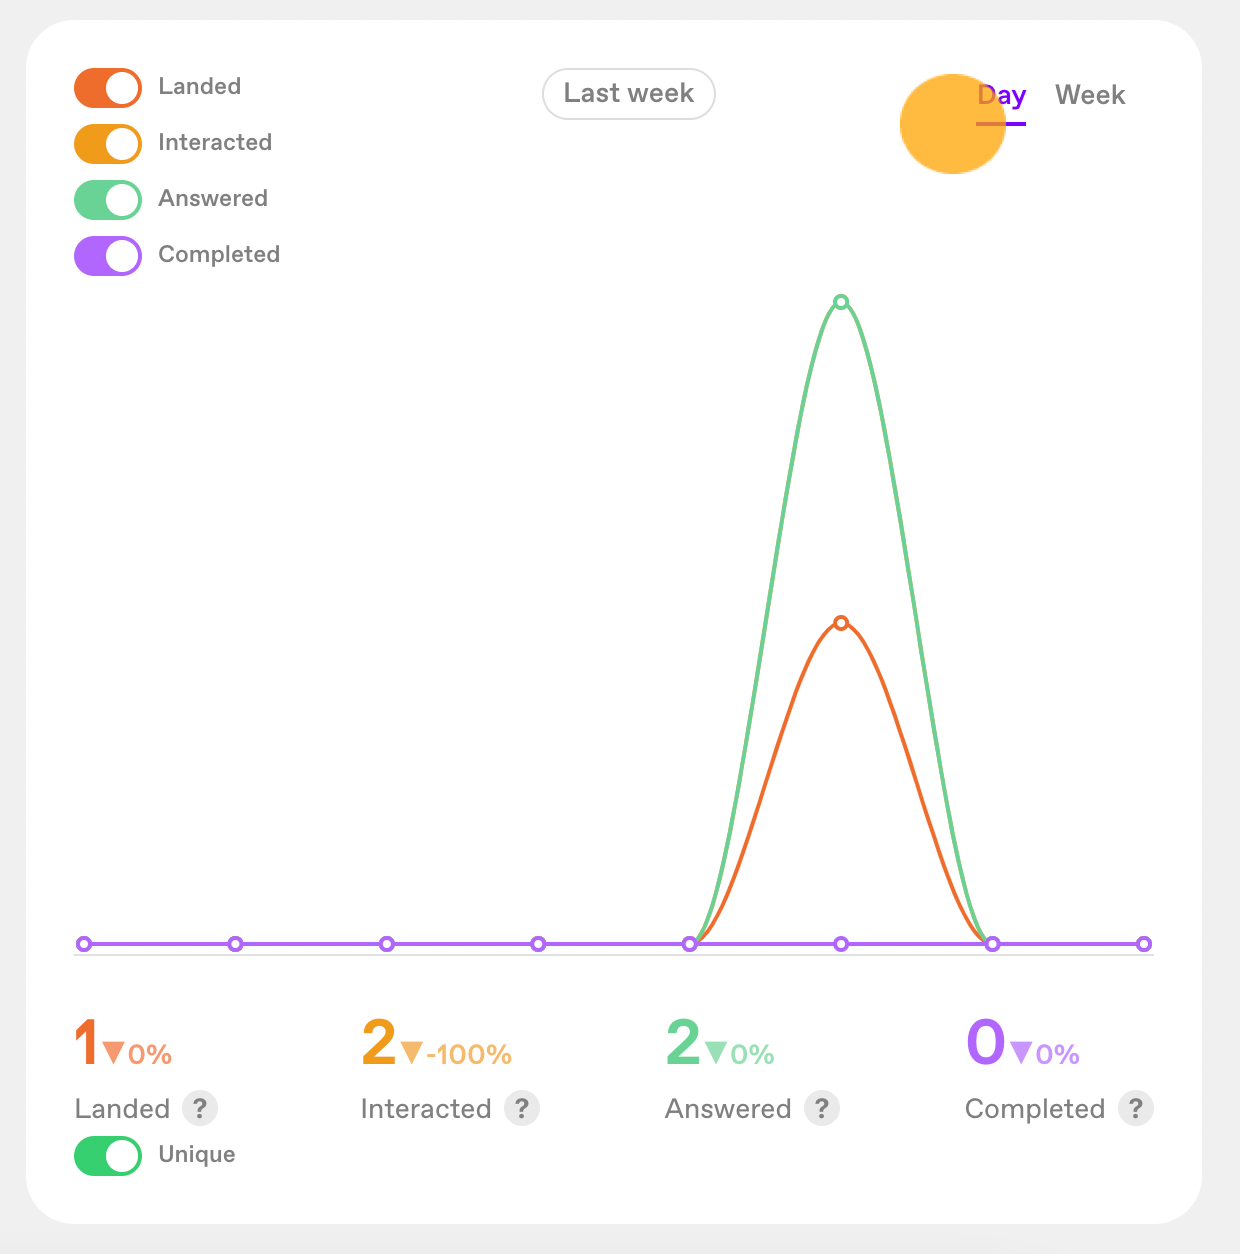
Filter by completion
Choose the data you want to display on your graph by enabling or disabling the Landed, Interacted, Answered, or Completed options.
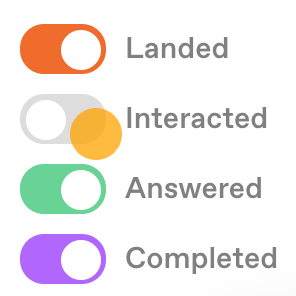
- Landed: how many times people opened your videoask link
- Interacted: how many times people opened your videoask link and clicked on it
- Answered: how many times people answered at least one question in your videoask
- Completed: how many times people submitted their answer to your videoask
See unique visits
Enable or disable Unique visits to see how many visitors landed on your videoask altogether vs the number of unique landings from different IP addresses.
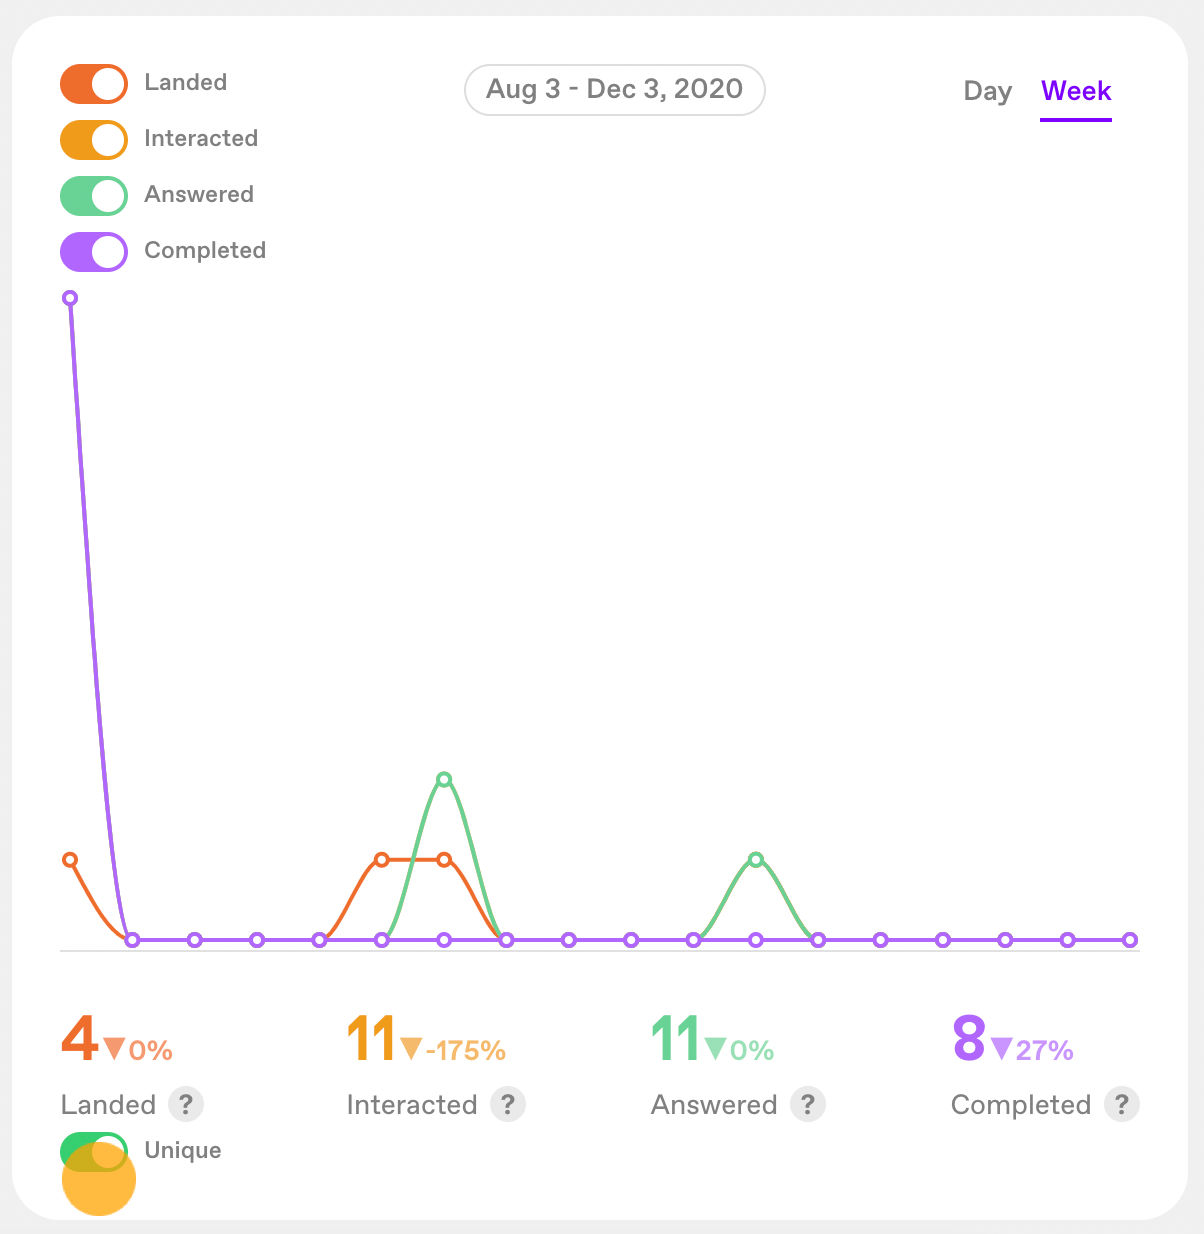
Note: The Unique filter only applies to your Landed metrics and does not apply to your Interacted, Answered, or Completed metrics. This means that if the Unique option is enabled, your Landed metric could be a lower number than the Interacted, Answered, or Completed metrics.
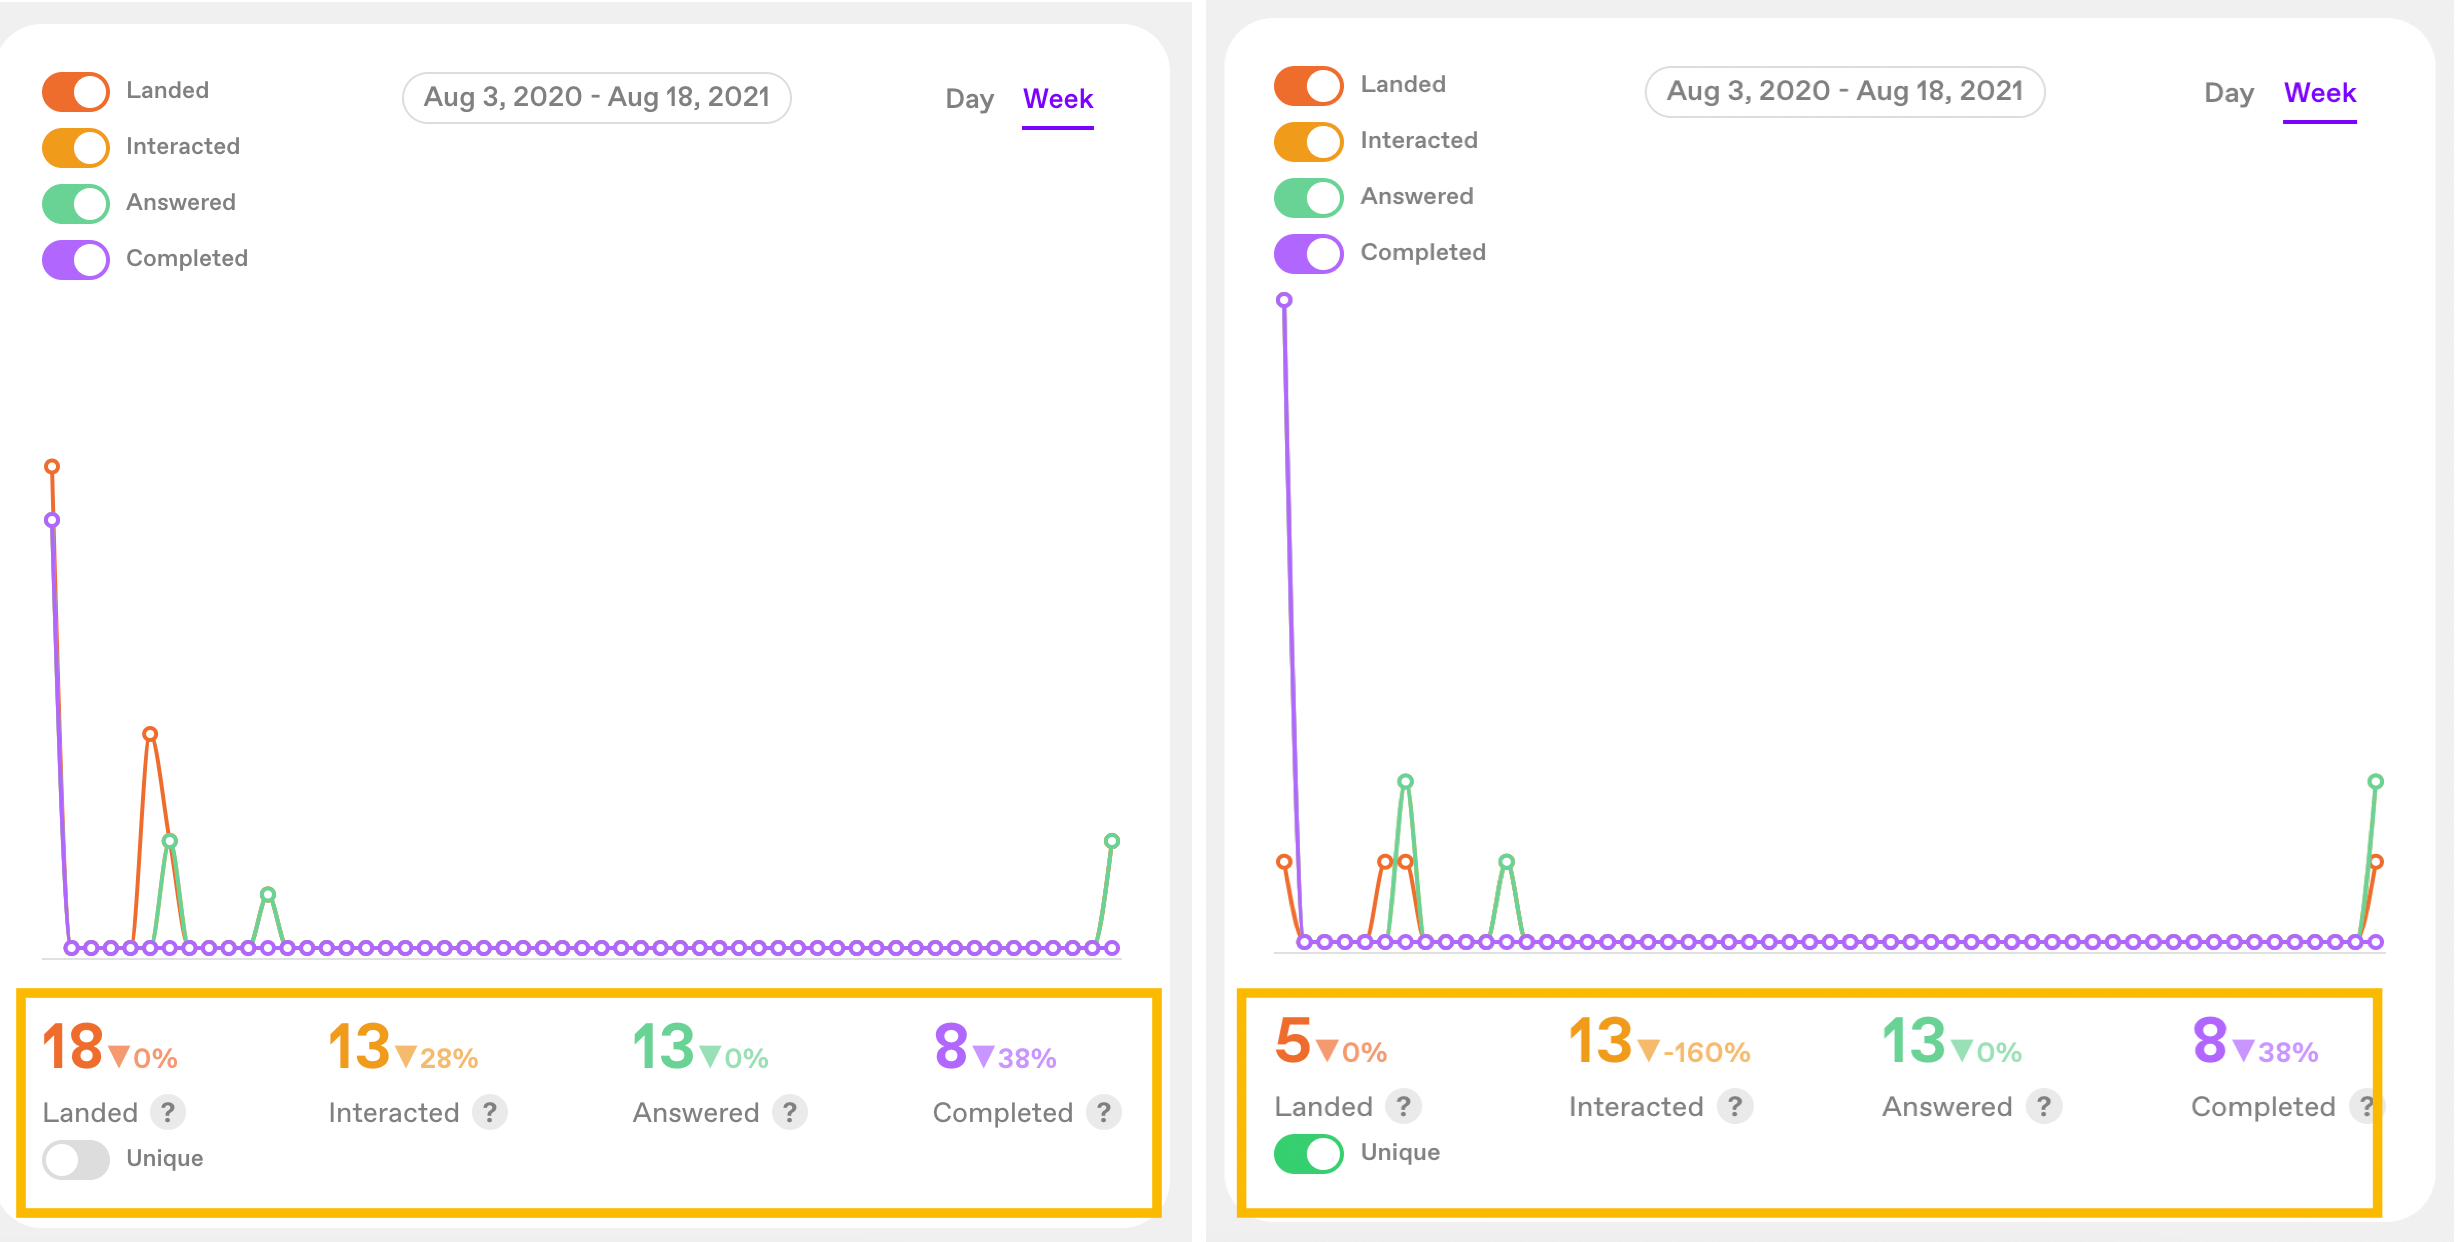
For example: In the screenshots below respondents have landed on our videoask 18 times and 13 have interacted with it. However, 13 of these 18 landings were from the same IP address.
When we turn Unique views on we see that only 5 different people have landed on our videoask, but we have had 13 interactions overall (including unique and repeats).
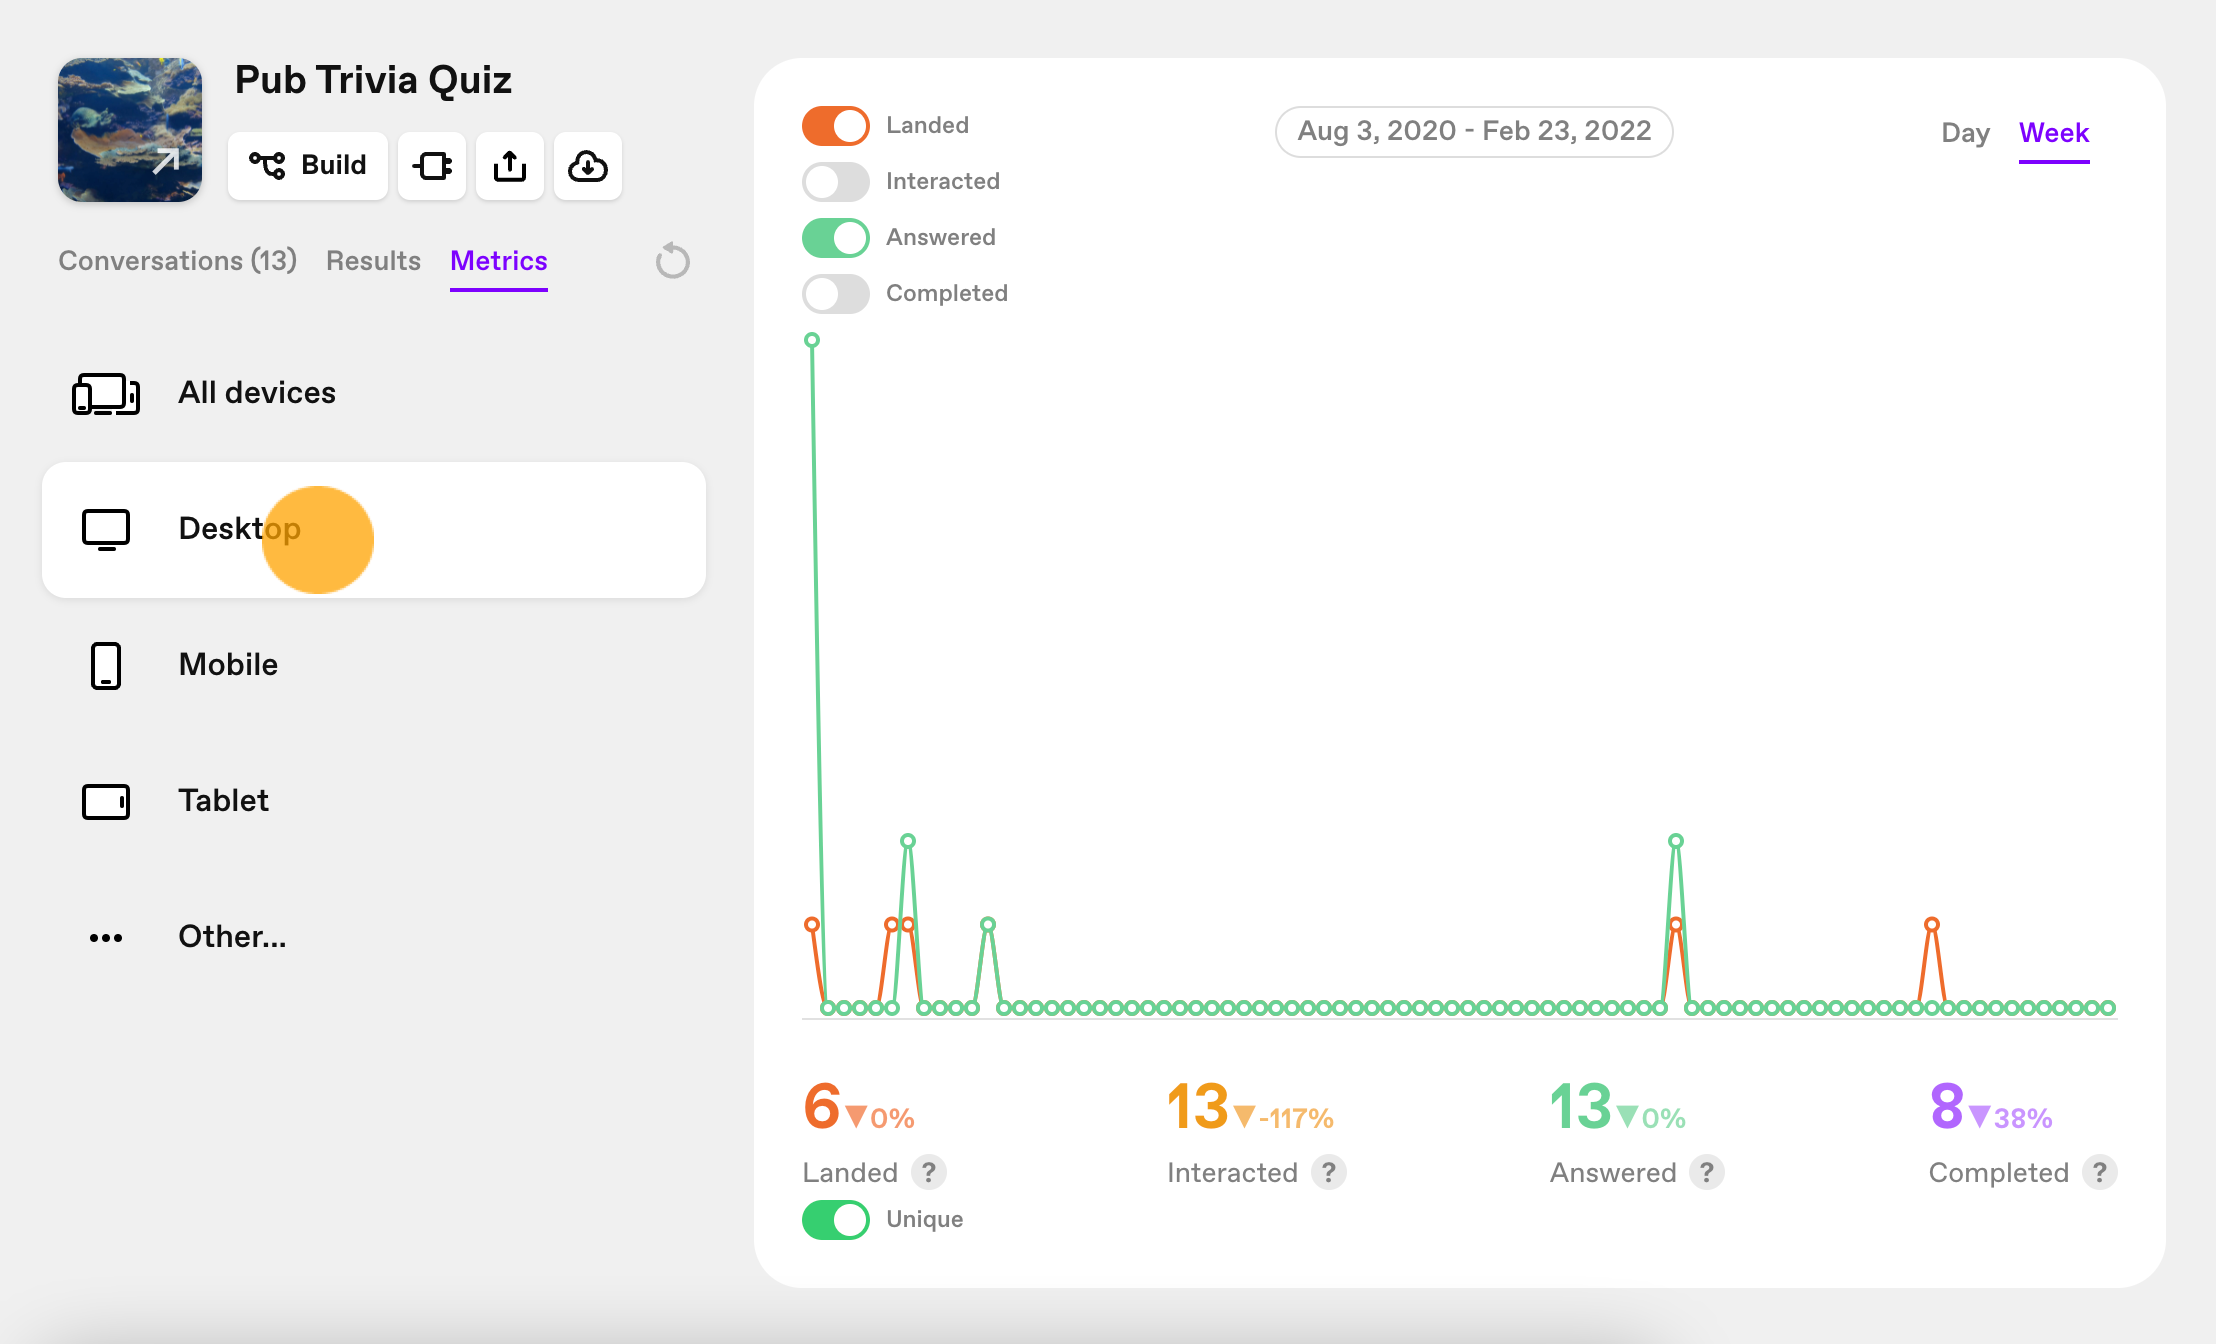
Filter by device
Get a better idea of exactly how people are viewing your video content by filtering by device.
Select the device type to filter responses accordingly.
Filter by date
If you want to see the engagement with your videoask during a specific time frame or campaign, you can filter your data by date.
To filter your metrics by week, month, year, or a custom time period, select dates on the calendar and click Apply.
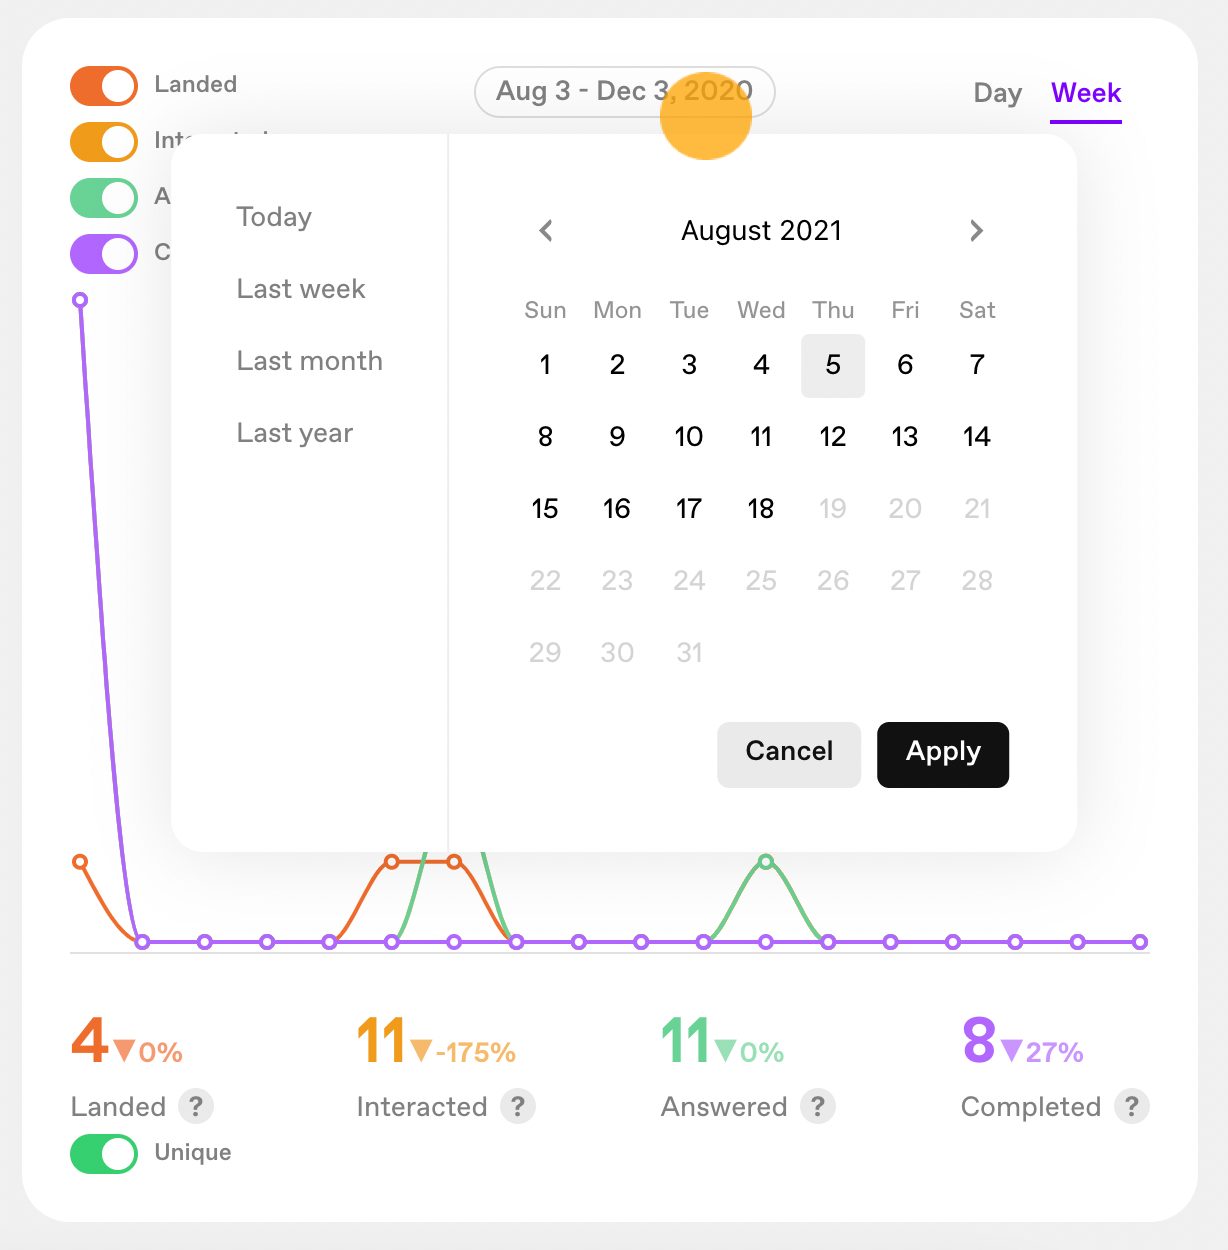
Select Day or Week to change the view for the given time period.
View results per step
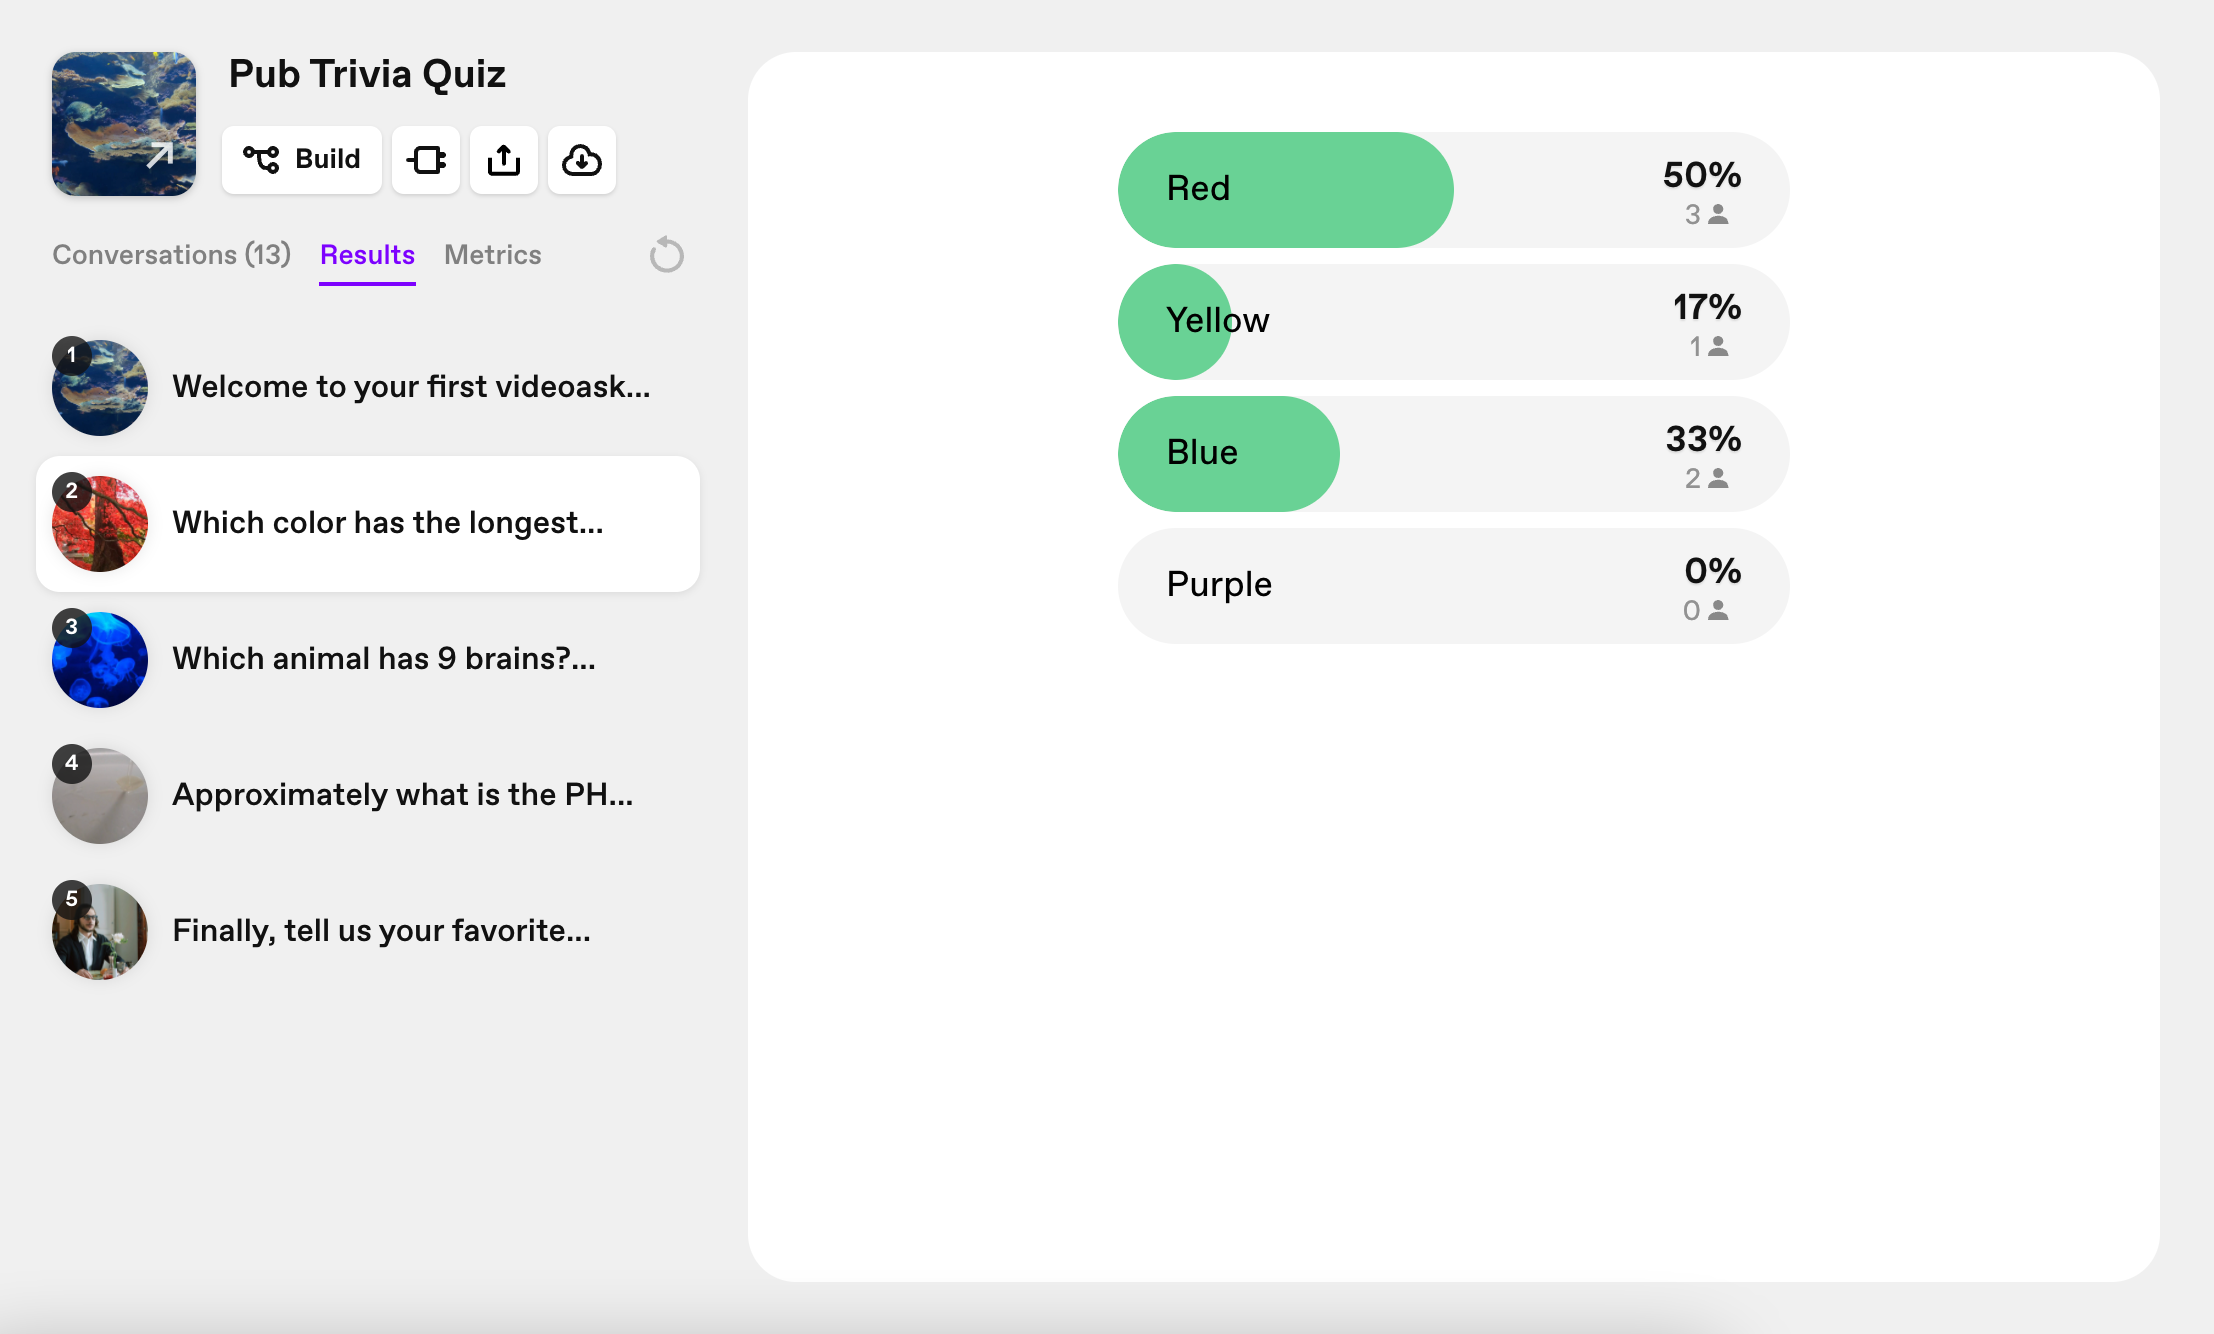
To view stats per step of your videoask, select the Results tab.
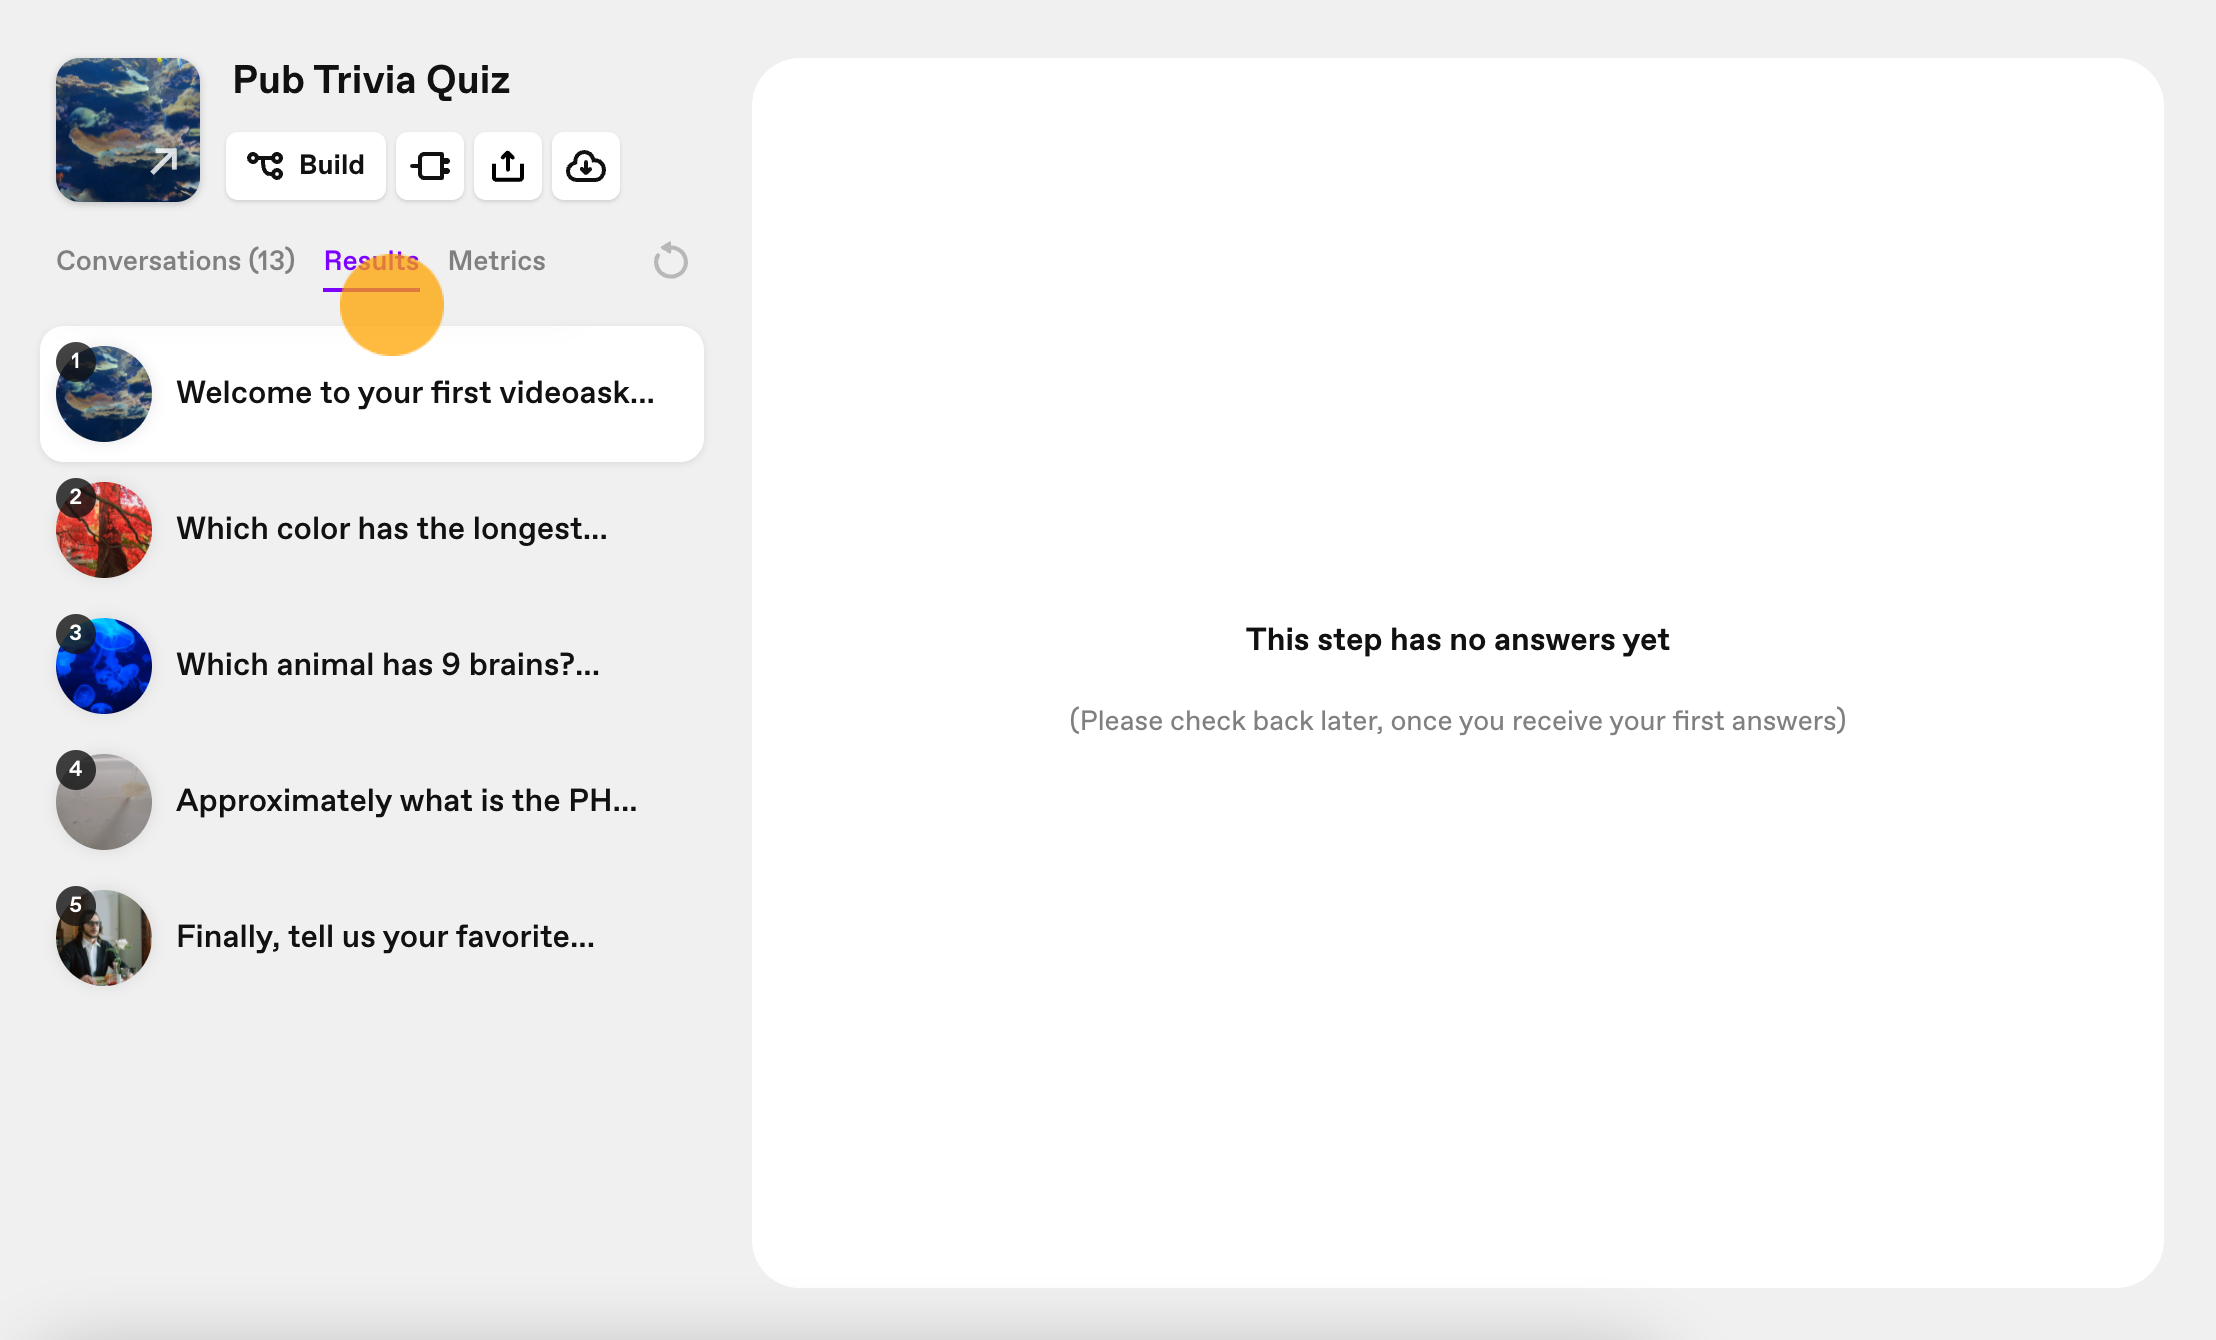
Note: If you have skipped data collection for a step, no data will appear here.
Click each step to view a summary of all the responses you've received so far.
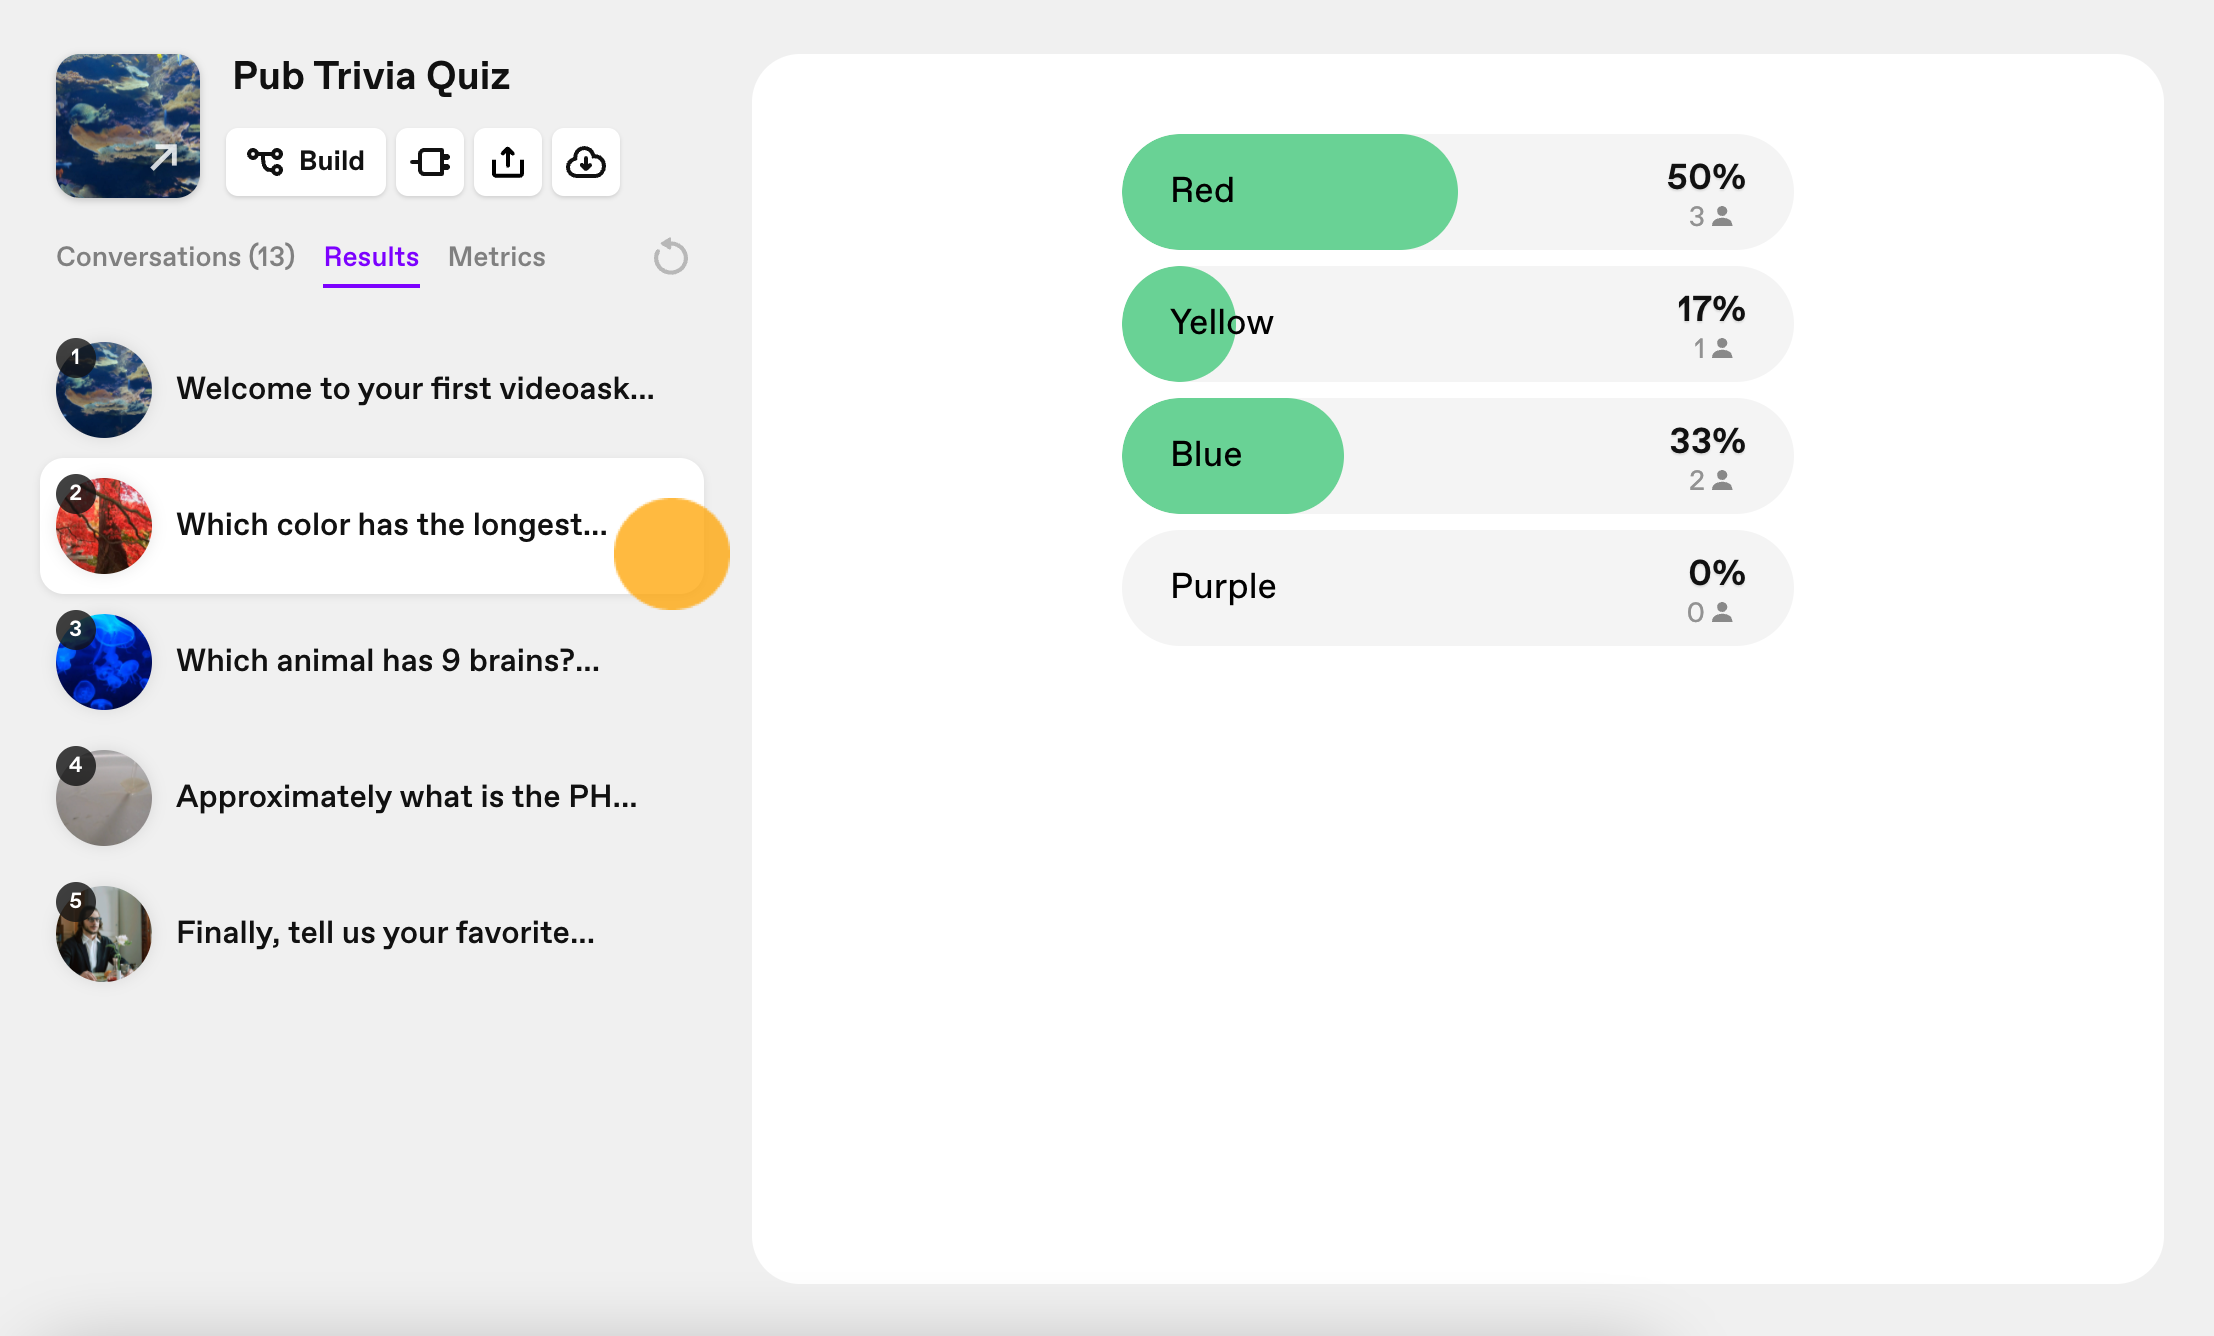
Be aware that the step response data will display differently depending on the answer type you selected for the step.
Metrics overview
There are a number of different ways you can get the data you need to analyze and optimize your videoask. Some of this data is built into the app itself, while other data can be exported or synced with reporting tools using one of our integrations.
If you're not sure where to look for a specific bit of data, this handy overview should guide you in the right direction:
Drop-off analysis
Drop-off analysis is a part of the videoask builder and provides metrics for each step of your videoask to help you calculate the drop-off rate of a multi-step videoask. With this feature you can dive into:
- Number of respondents who landed on a particular step
- Number of respondents who watched at least 75% of your video on a particular step
- Number of respondents who advanced from a particular step to the next step
- The overall drop-off rate for a particular step (as a percentage)
You can filter the above data by last 24 hours, last 7 days, last 30 days, all time, or choose a custom range.
You can also set a warning threshold to highlight steps in red when they reach a given drop-off threshold (to help spot steps that could be optimized).
Metrics
The Metrics area provides an overview of data per videoask (and is not broken down for each step). Here you can dig into:
- Total number of respondents who landed on your videoask
- Number of unique landings on your videoask (visits from unique IP addresses)
- Total number of respondents who interacted with your videoask page
- Total number of respondents who answered at least one step of your videoask
- Total number of times your videoask has been completed
You can filter the above data by date and device used.
Results
In the Results area of a videoask, you can see a summary of all the responses received for a particular step in your videoask so far. The format of your responses will depend on the answer type you have selected for the videoask step.
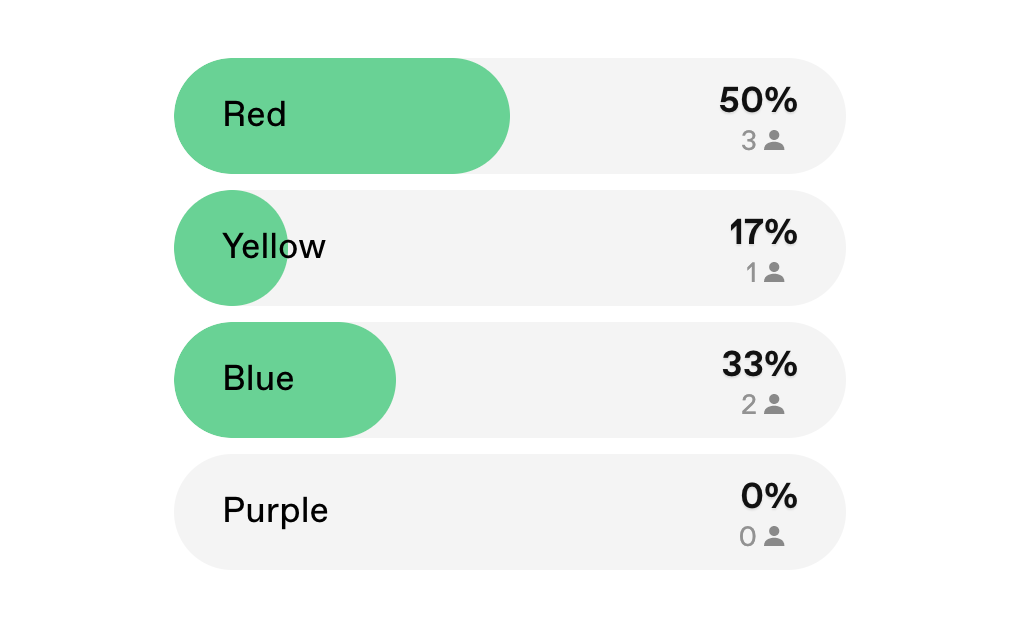
Multiple Choice
If your answer type is multiple choice, you can see how many respondents have chosen each option in number and percentage terms.
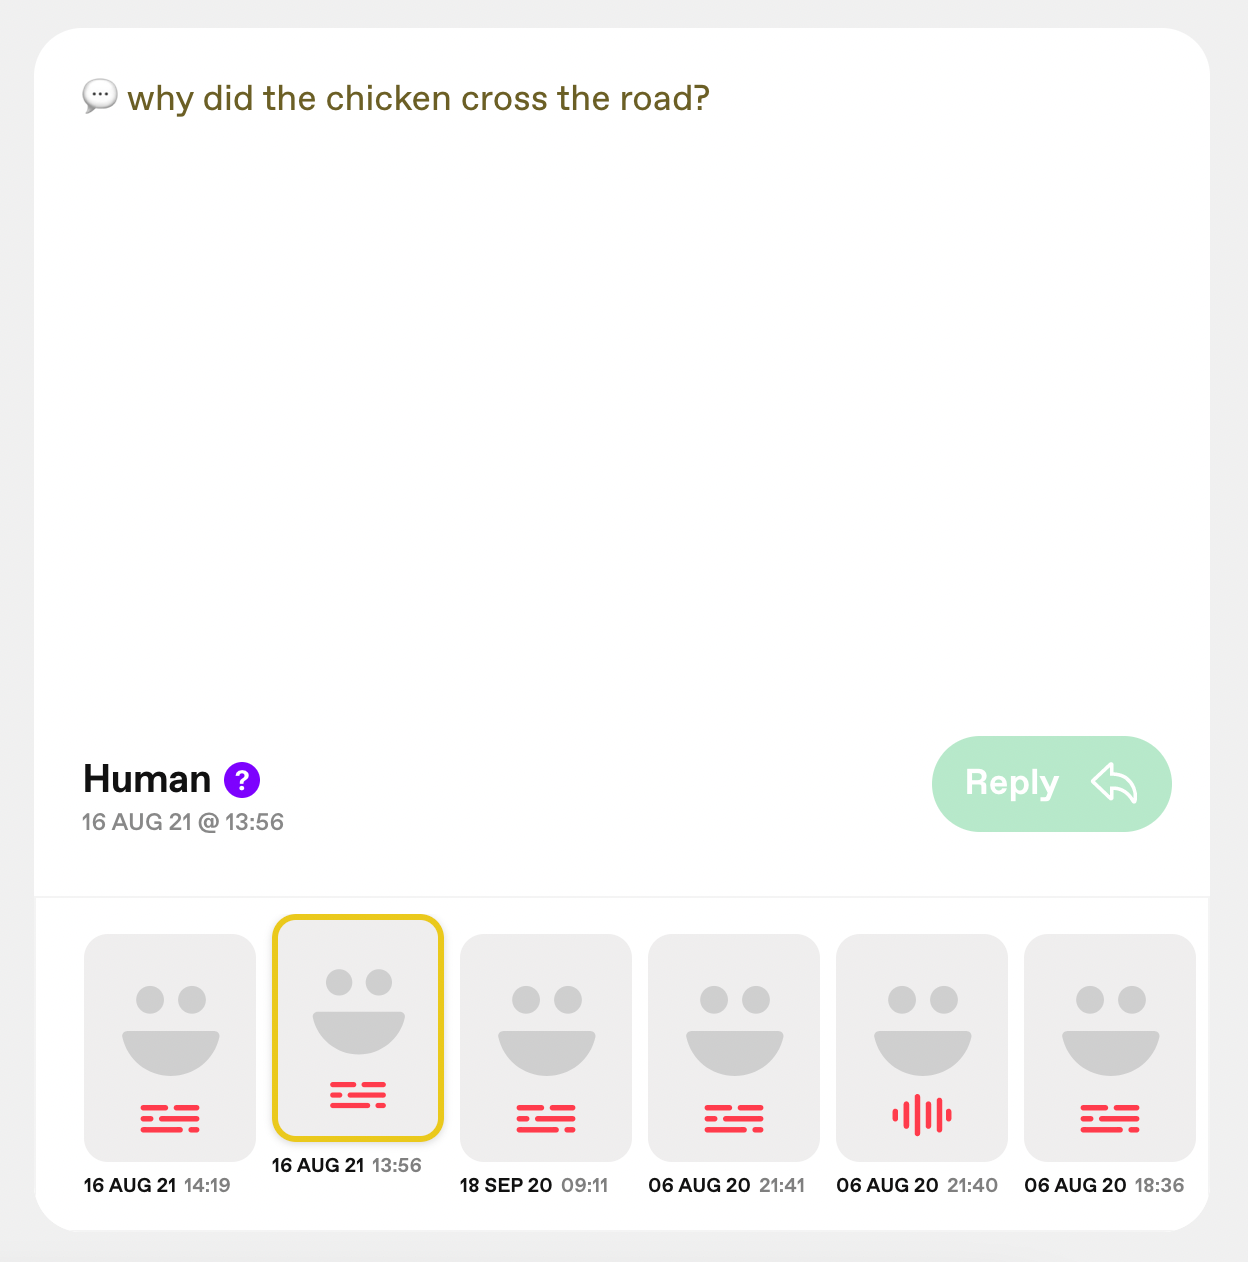
Open Ended
If your answer type is open ended, you can scroll through respondents' individual answers in text, audio, and video format.
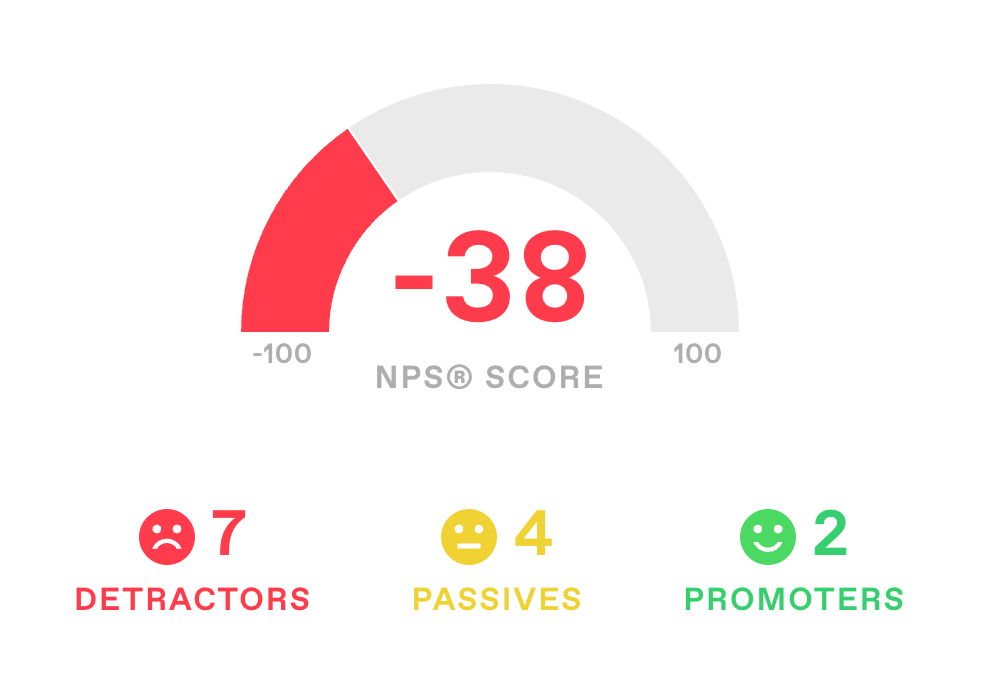
Net Promoter Score
If your answer type is NPS®, you can see the average net promoter score and number of detractors, passives, and promoters.
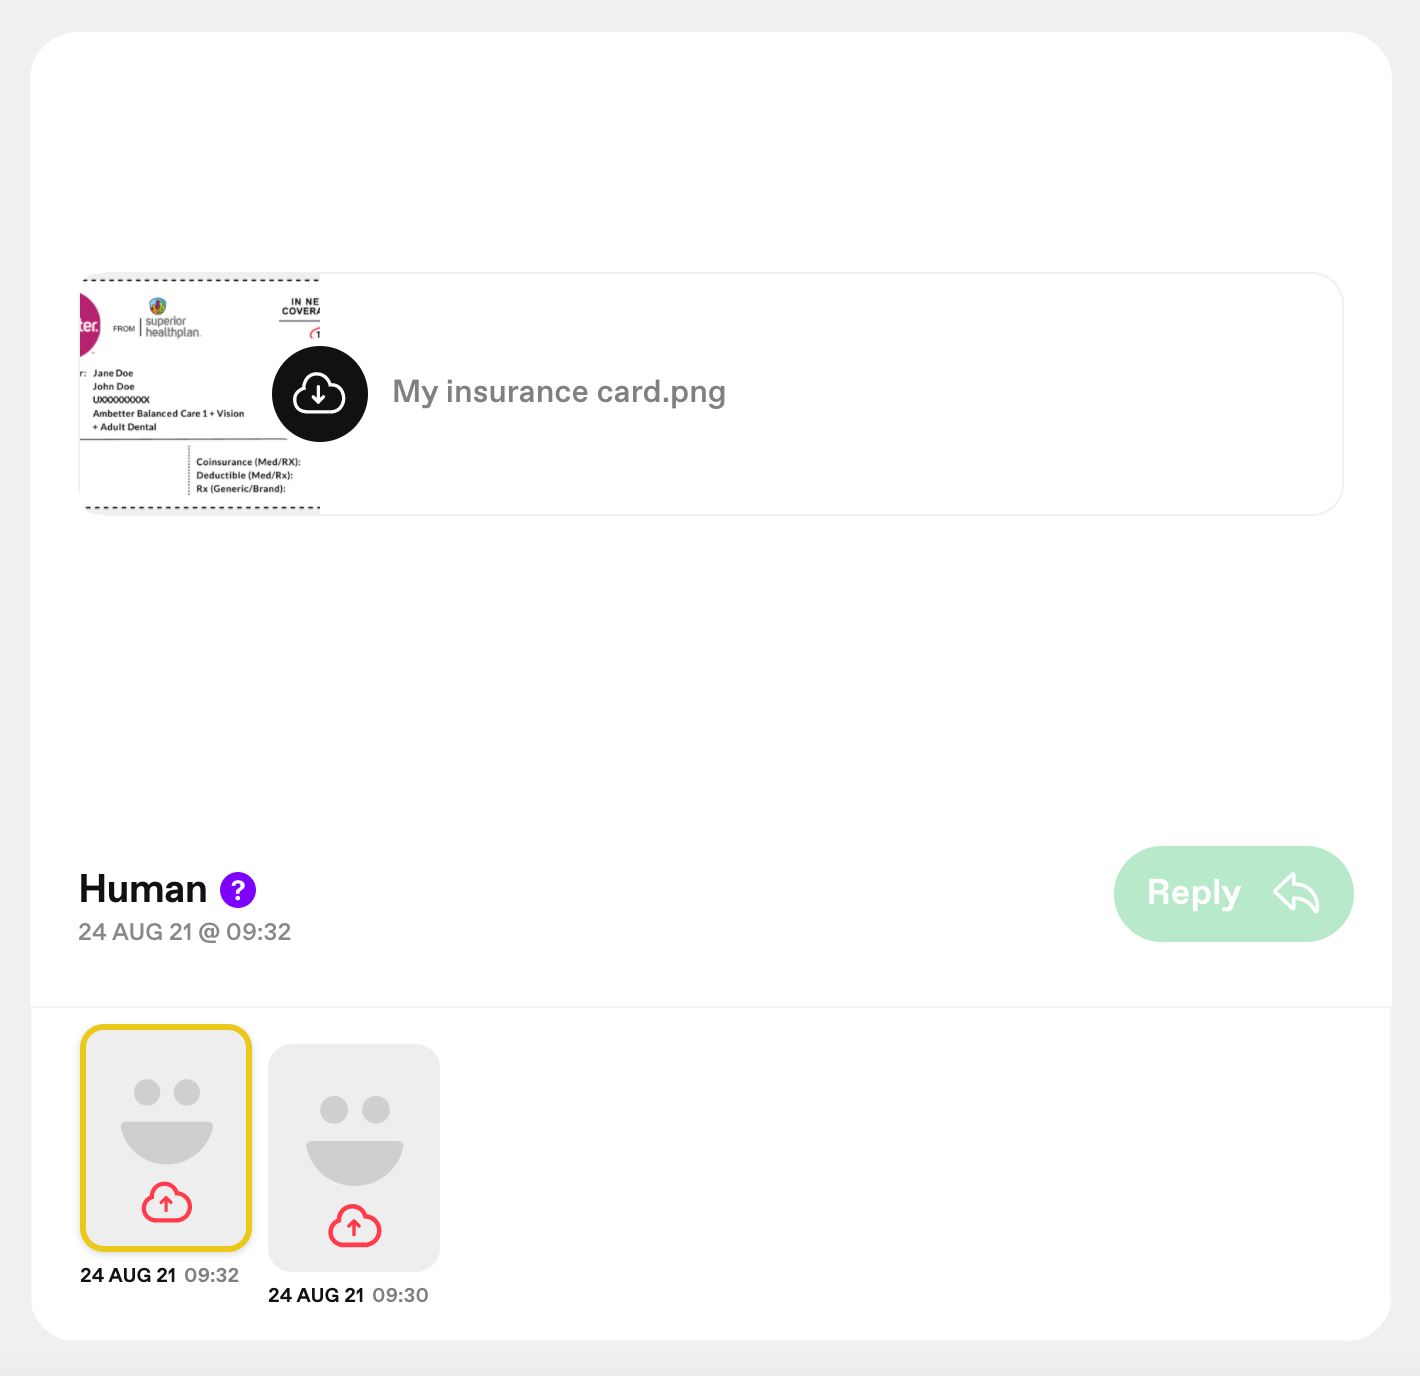
File Upload
For the file upload answer type, you can scroll through to see (and download) the files that respondents have submitted.
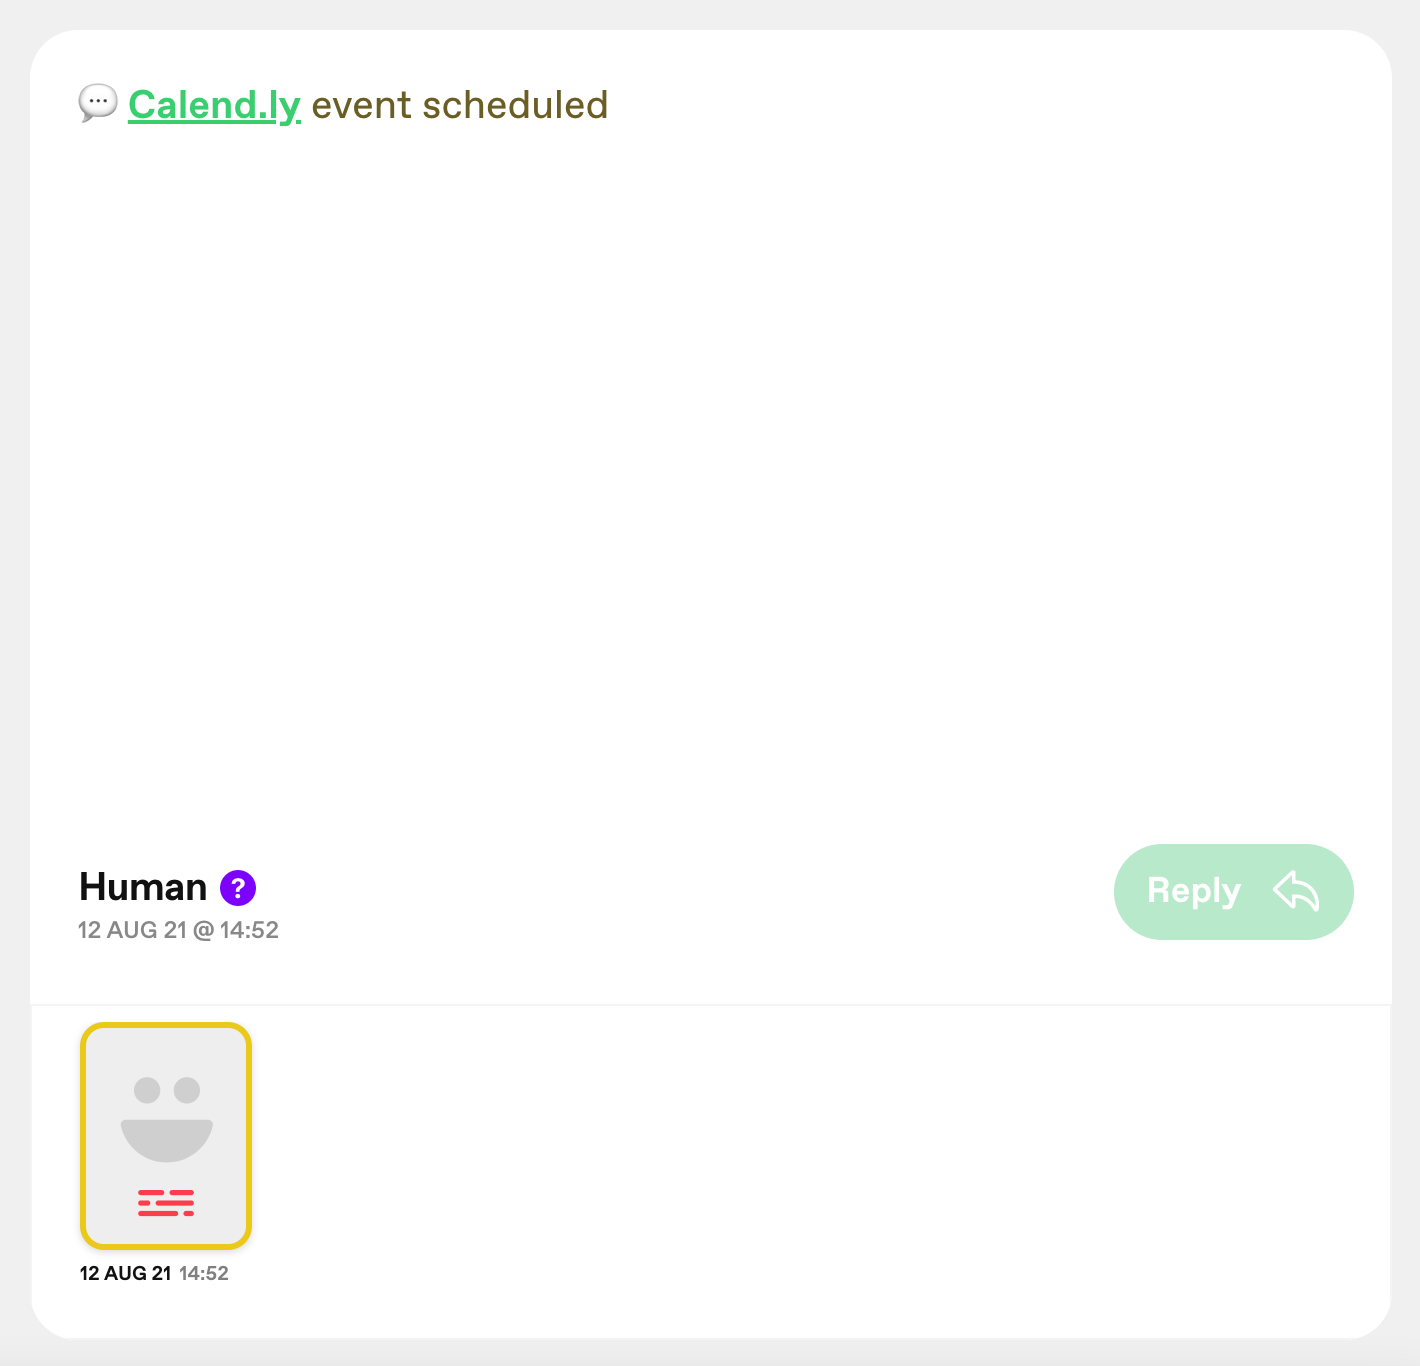
If your answer type is calendar, you'll see a confirmation if appointments have been booked on that step.
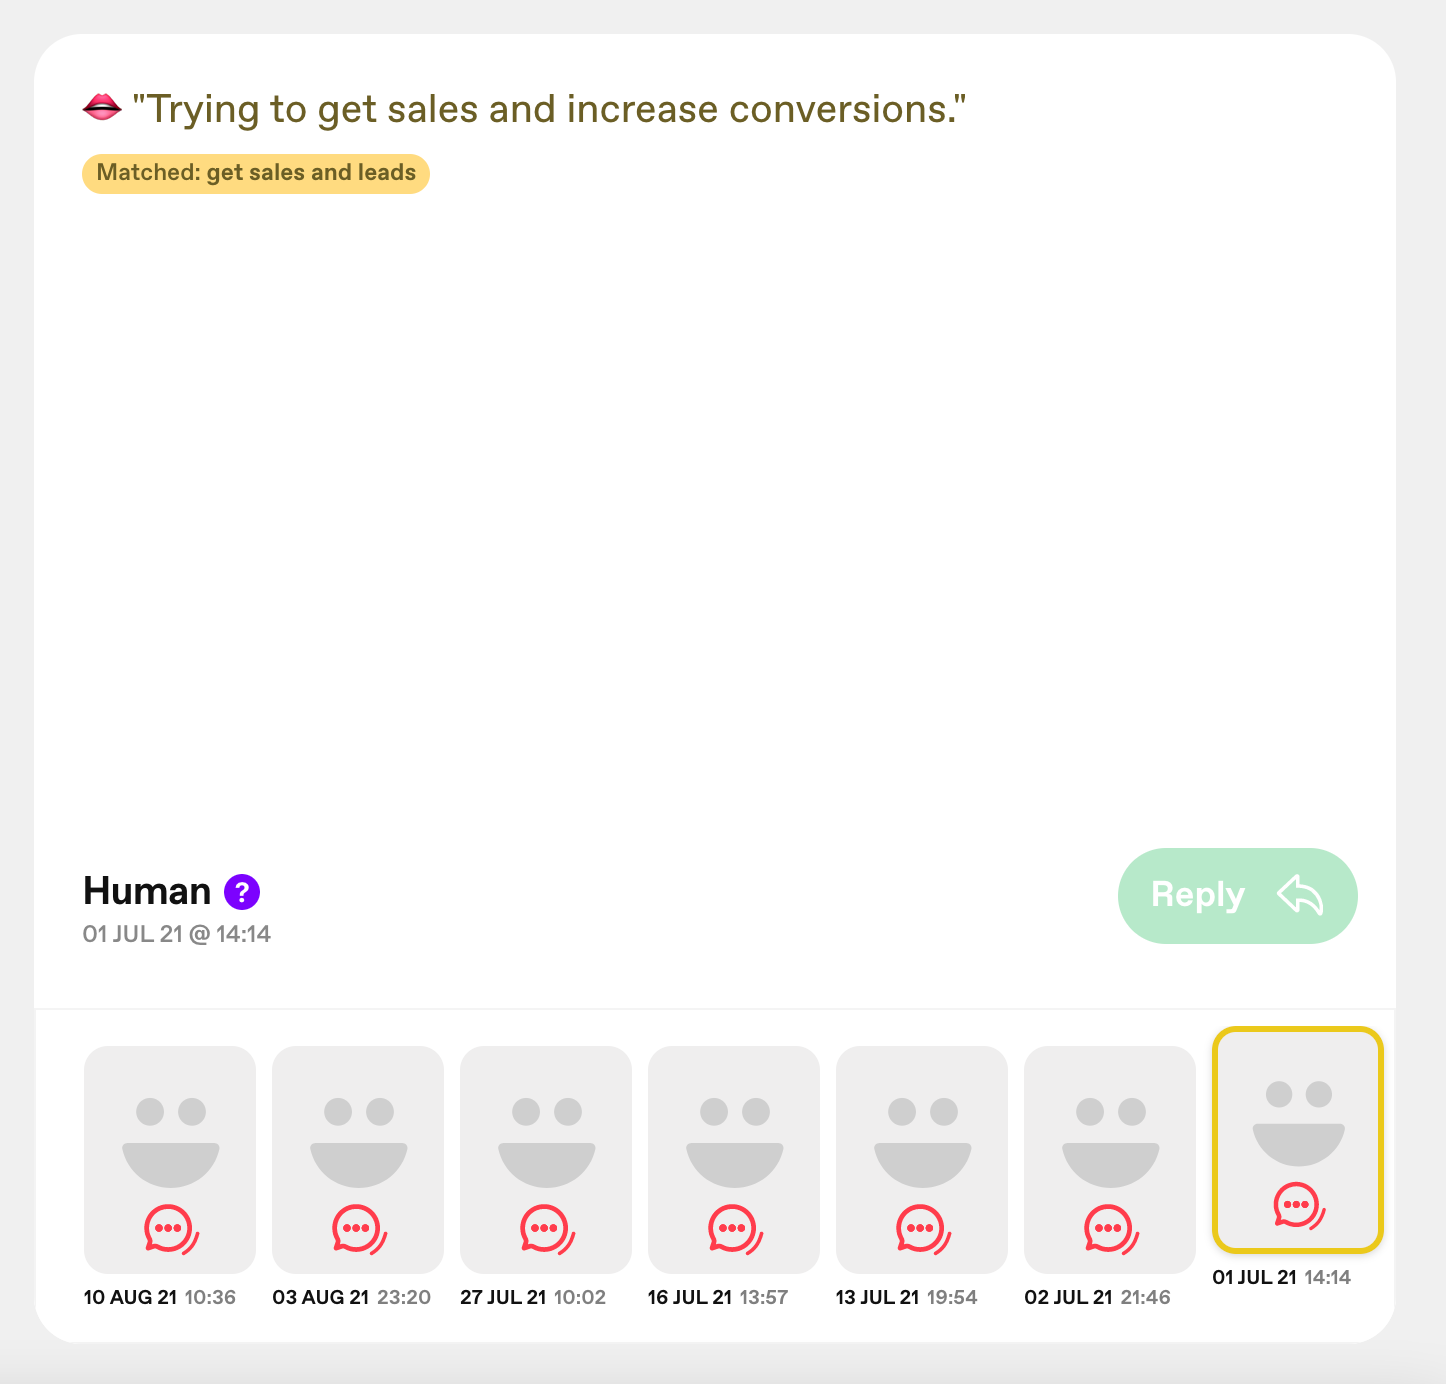
If your answer type is voice, you can scroll through to see a transcript of each respondent query and what category they matched with.
To conduct a more advanced analysis of the responses you receive with your preferred spreadsheet software, you can connect your videoask to Google Sheets or export a .csv or .xlsx file of your responses.
If you'd like to use an alternative database or spreadsheet software such as Airtable, you can connect your videoask to almost any online tool via Zapier
For additional tracking and to centralize your marketing or site data, learn how to connect your videoask to Google Analytics, Google Tag Manager, or Facebook Pixel.